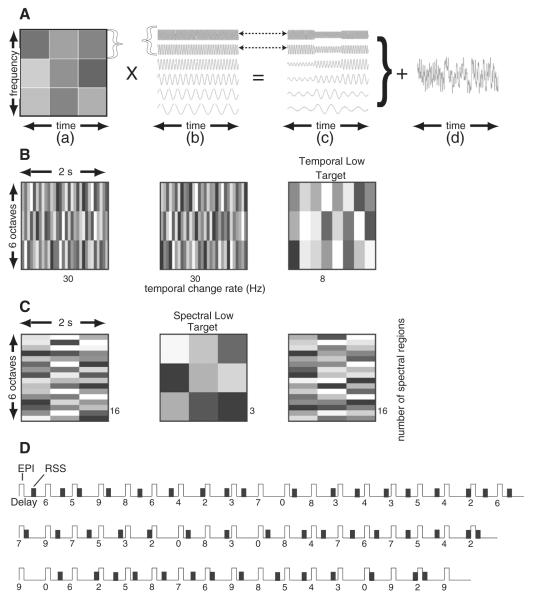
Fig. 4.
Spectral and temporal random spectrogram sounds (RSS) and interrupted iterative stimulus presentation sequence. A. An example creation of an RSS stimulus based on a spectrographic grid of 9 random sound intensities (a) and a grouping of 6 pure tones (b). Amplitude modulated tones resulted from multiplying one row of random amplitudes for a group of tones whose rates of change in amplitude followed from the columns and the spectrum amplitude modulations followed from the rows (c). Summation across the groups of modulated tones produced a single RSS (d). B. Temporal RSS utilized spectrograms in which temporal rates reflected the number of columns (per unit of time) of different amplitudes. Higher complexity sounds had 30 and lower complexity had 8 Hz rate changes. Three tone groups divided the six octaves of tone frequencies into equal numbers of pure tones. C. Spectral RSS utilized spectrograms containing different subdivisions of the 6 octaves (rows in the spectrogram). Higher spectral complexity sounds had 16 and lower complexity had 3 spectral subdivisions. D. A single imaging run contained multiple 11 s volume acquisitions (TR) in which echo-planar pulse sequences (EPI) of 2 s duration were at the beginning of each acquisition. RSS presentation occurred during silent periods preceding each acquisition with delays of 2–9 s prior to the subsequent TR. There were six randomly distributed repeats of each delay time per run.

