
Figure 2.
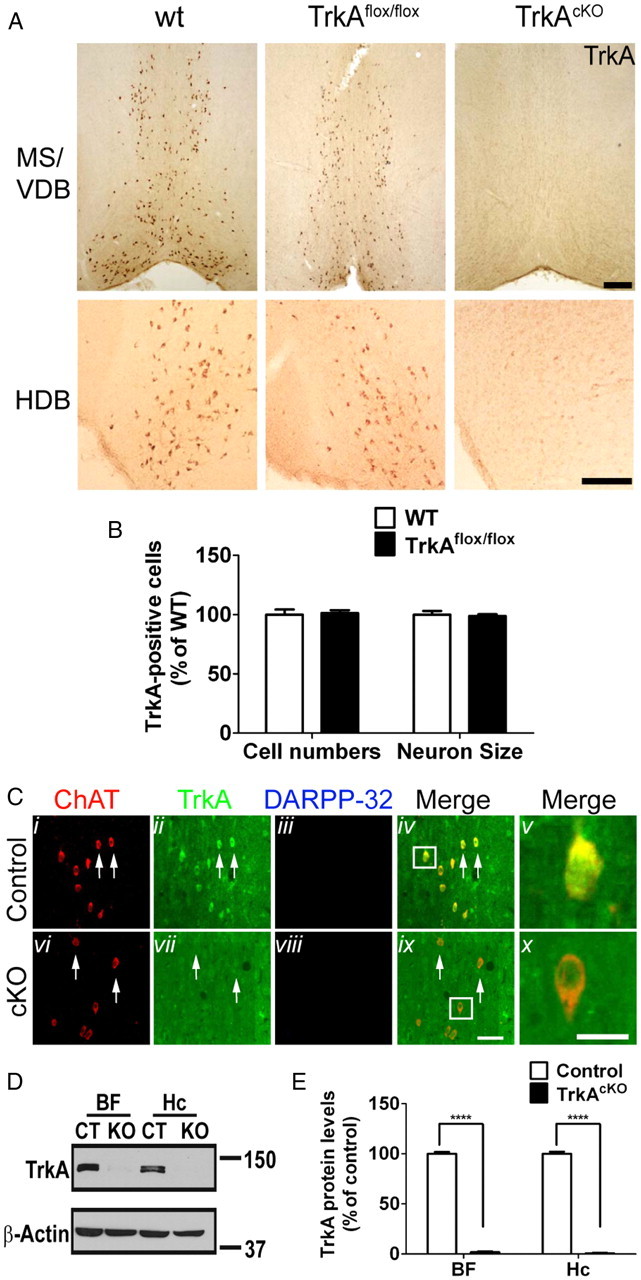
TrkA expression in BF of TrkAcKO mice. A, TrkA expression in wild-type, TrkAflox, and TrkAcKO mice. Neurons in BF of P10 mice were stained with anti-TrkA antibody. B, Analysis of TrkA-positive neuronal cell numbers and size in MS/VDB region. n = 4 mice in cell numbers; n = 17–21 cells in neuron size. C, TrkA is ablated in BFCNs. P30 mice were processed for immunofluorescence using indicated antibodies. Arrows, TrkA-expressing (ii) and TrkA-depleted (vii) BFCNs; in merged pictures, Cv and Cx show enlargement of cells in the boxed areas in Civ and Cix. D, E, Quantitative Western blot analysis of TrkA expression in BF and hippocampus of P30 mutant mice. Molecular weight markers (kDa) are shown. Hc, Hippocampus. ****p < 0.0001 when compared with control; n = 6 per genotype in BF and n = 3 per genotype in Hc group. Scale bars: A, 400 μm; Ci–iv,vi–ix, 50 μm; Cv,x, 25 μm.