
Figure 3.
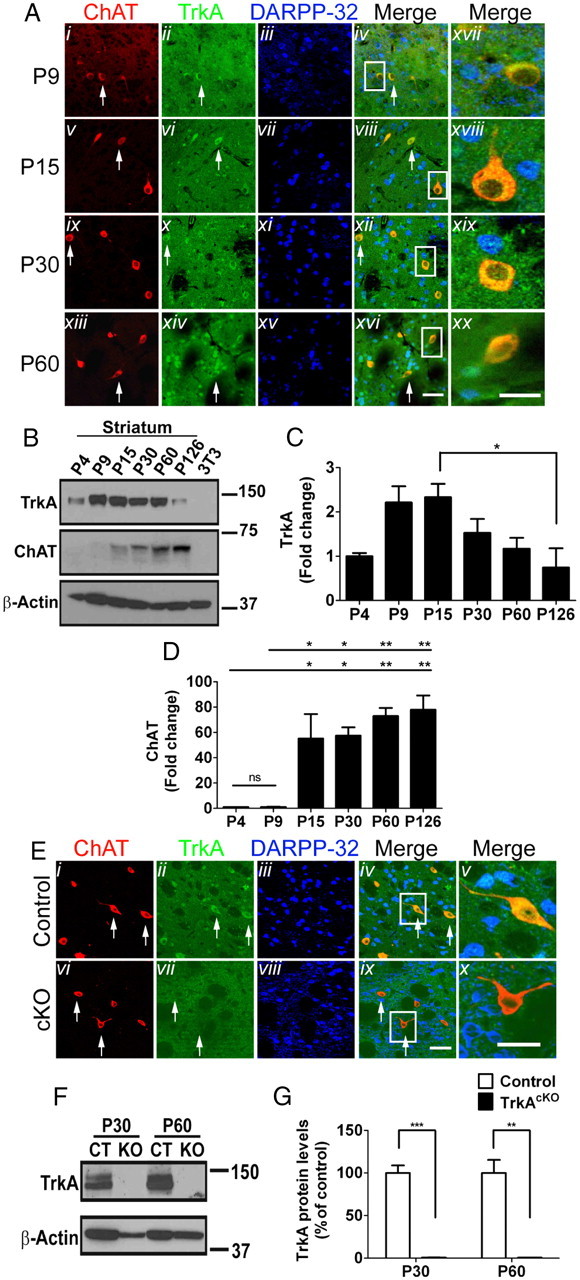
TrkA expression in striatum of wild-type and TrkAcKO mice. A, TrkA expression in striatal cholinergic neurons. Mice were processed for immunofluorescence at the indicated ages. Merged pictures: Axvii–xx show enlargements of cells in boxed area in Aiv, vii, xii, and xvi. B–D, Western blot (B) and quantitative analysis of TrkA (C) and ChAT (D) expression in striatum. 3T3, NIH3T3 lysates were used as negative controls; n = 3 per group. E, TrkA ablation in striatal cholinergic neurons of TrkAcKO mice. At P30, control or mutant animals were processed for immunofluorescence with the indicated antibodies. Arrows, TrkA-expressing (Eii) and TrkA-depleted (Evii) striatal cholinergic neurons; in merged pictures, Ev and Ex show enlargement of cells in Eiv and Eix. F, G, Immunoblot (F) and quantitative analysis (G) of TrkA protein levels in striatal tissue lysates of control or TrkAcKO mice. n = 3 per genotype in each group. *p < 0.05, **p < 0.01, ***p < 0.001. Scale bars: Ai–xvi, 50 μm; Axvii–xx, 25 μm; Ei–iv,vi–ix, 50 μm; Ev,x, 25 μm.