
Figure 6.
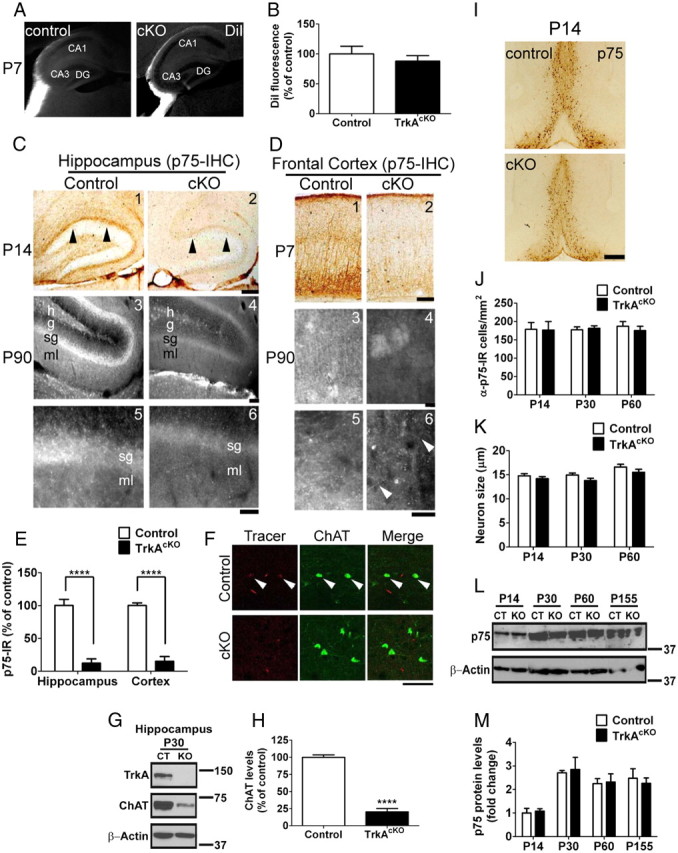
Effect of TrkA ablation on cholinergic input to hippocampus and cortex. A, DiI anterograde tracing of BFCNs. Cholinergic projections around the hippocampus are clearly seen in both brains as early as P7. Analysis at later stages showed a similar projection pattern (data not shown). CA, Cornu ammonis; DG, dentate gyrus. B, Quantification of DiI fluorescence in P7 control and mutant mice brains. C, DAB (1,2) and fluorescence staining (3–6) of cholinergic axonal innervation into hippocampus with anti-p75 antibody. As early as P14, control hippocampus contains p75-IR fibers not observed in TrkAcKO mice (C1,2). This is not due to a delay of innervation as there is no innervation of p75-IR fibers at P90 in TrkAcKO hippocampus (C4,6); a mature pattern of innervation was seen in control (C3,5). h, Hilus; g, granule cell layer; sg, sub granular cell layer; ml, molecular layer. D, DAB (1,2) and fluorescence staining (3–6) of cholinergic axonal innervation to cortex. At P7, frontal cortex from control mice exhibits intense staining of p75-IR fibers, which is dramatically decreased in TrkAcKO mice. Unlike hippocampus, there are some p75-IR fibers in the frontal cortex in TrkAcKO (C6, arrowheads in magnified field). E, Quantification of axonal innervation as indicated by p75-IR in P14 hippocampus and P7 cortex of control and mutant mice. n = 6 in hippocampus; n = 5 in cortex; ****p < 0.0001. F, Retrograde tracing of BFCNs by Texas Red-dextran amine. Texas Red-dextran amine was retrogradely transported from frontal cortex to BFCNs in control (arrowheads), but not in TrkAcKO mice. n = 3 mice per genotype. G,H, Quantitative Western blot showing decreased ChAT levels in hippocampus. n = 4; ****p < 0.0001. I, Despite the dramatic reduction of p75-IR fibers in TrkAcKO hippocampus and cortex, p75-IR neurons in BF are comparable between control and mutant animals. J, Evaluation of cell density in control and TrkAcKO p75-IR neurons. n = 4 mice per genotype. K, Cell size analysis of p75-IR neurons in control and mutant mice. n = 35 neurons per genotype among three mice. L, M, Immunoblot of p75 levels in BF. n = 3 mice per genotype. Scale bars: C, D, 200 mm; F, 50 μm; I, 400 mm.