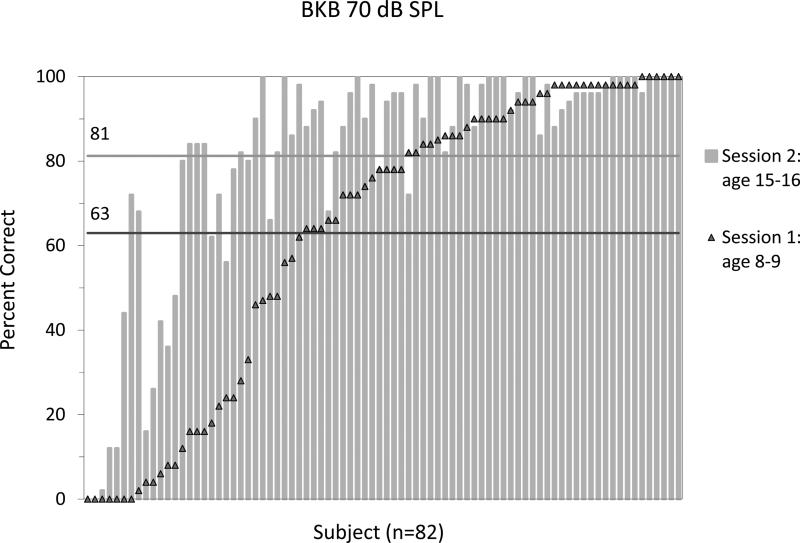
Figure 2.
Individual percent-correct scores for the BKB-Q test at sessions 1 and 2, rank ordered by session 1 scores from lowest to highest. Session 1 scores are represented by black triangles while session 2 scores are represented by grey columns. Group mean scores are shown by the horizontal lines, in black for session 1 and in grey for session 2.

