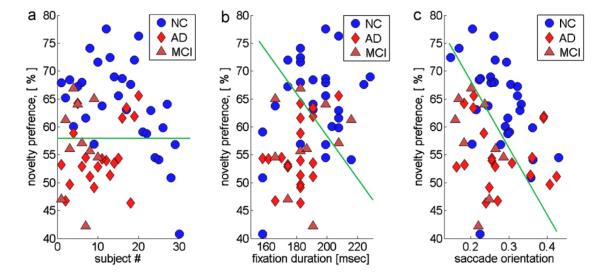
Fig. 2.
Separation between groups without using classification algorithms. (a) The novelty preference for NC, AD, and MCI groups; (b) the median fixation duration (X-axis) plotted as a function of novelty preference (Y-axis) for all three groups; (c) median of vertical saccades fraction (X-axis) plotted as a function of novelty preference (Y-axis). The green line indicates a possible linear separation boundary. (For interpretation of the references to color in this figure legend, the reader is referred to the web version of the article.)

