Figure 6.
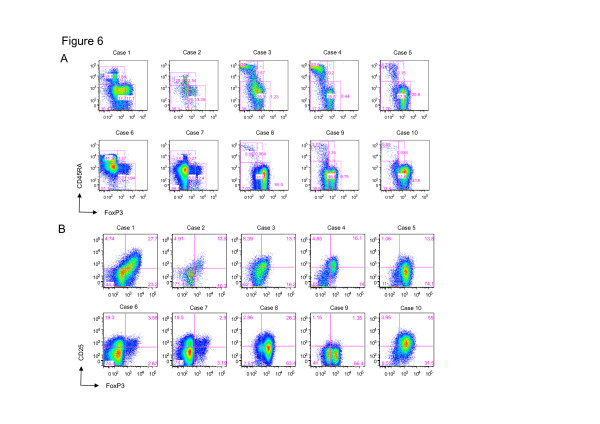
Characterization of CD4+T-cell subsets in ATL cells. PBMCs from ATL patients (n = 10) were stained with anti-CD4, anti-CD45RA, anti-CD25, and anti-FoxP3 antibodies and analyzed by flow cytometry. (A) The expression pattern of CD45RA and FoxP3 of CD4+ T cells in ATL patients. (B) The expression pattern of CD25 and FoxP3 of CD4+ T cells in ATL patients.

