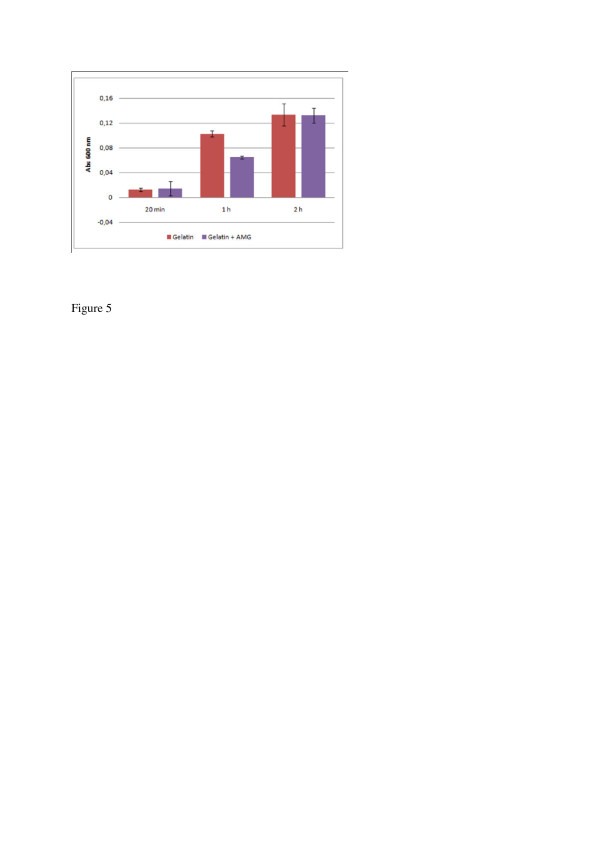
Figure 5.
Analysis of gelatin and gelatin/amelogenin (AMG) microparticle degradation at pH 7.0 in presence of trypsin. The bars indicate the accumulated release of aniline blue from the particles upon proteolytic degradation, as measured by aborbance at 600 nm. The error bars represent the standard deviation based on four replicates. The amelogenin containing microparticles showed an improved resistance to trypsin degradation after 1 h incubation.

