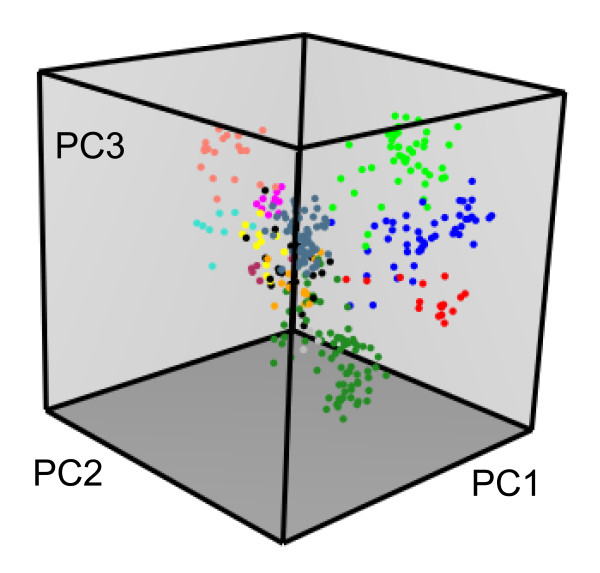
Figure 1.
3D representation of the GPCR sequence space. A typical multiple sequence alignment of 283 GPCRs from H. sapiens was analyzed by MDS, with distances based on difference scores. The 3D space is defined by the first three components of the MDS analysis. The color code refers to the different sub-families of human GPCRs, with unclassified receptors colored in black. Plot obtained with the mmds.3D.plot function after coloring by GPCR sub-families with the col.group function.

