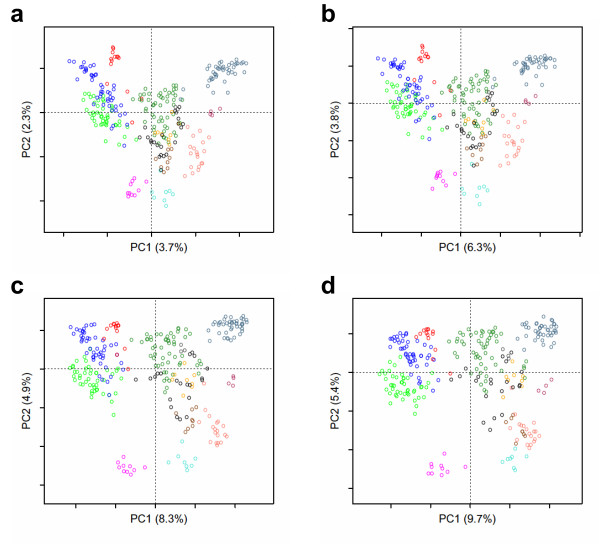
Figure 2.
Comparison of scoring methods. The 2D sequence space of human GPCRs, defined by the first two components of the MDS analysis, was obtained with distances equal to the square roots of the difference scores (a), to the difference scores (b), to the dissimilarity scores calculated from the BLOSUM45 matrix (c) or from the JTT_TM matrix (d). The color code refers to the different sub-families of human GPCRs, with unclassified receptors colored in black. Plots drawn with the mmds.2D.plot function after coloring by GPCR sub-families with the col.group function.

