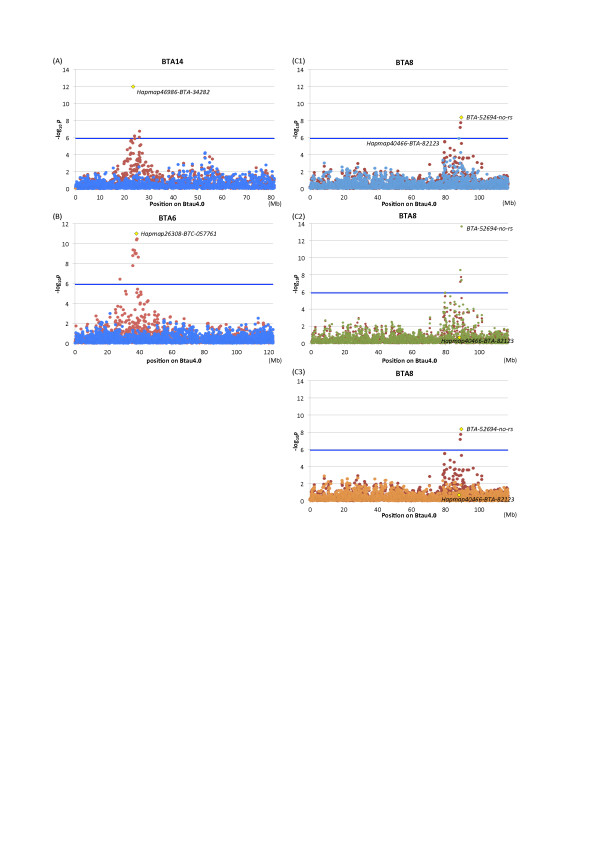
Figure 2.
Conditioned analyses. To examine whether the associations detected on a chromosome were independent, a conditioned analysis was performed by including a genotype of the most significant SNP on the chromosome as a covariate in the model. Red and blue dots represent p values in –log10 scale before and after conditioning, respectively. Large squares indicate the most significant SNP in the respective chromosomes. (A) BTA 14. (B) BTA 6. (C1) BTA 8. In BTA 8, Hapmap40466-BTA-82123 reached nearly genome-wide significance with conditioning on BTA-52694-no-rs (C1), while the association of BTA-52694-no-r became stronger with conditioning on Hapmap40466-BTA-8212 (C2, green dots). When conditioned on both SNP, associations of the surrounding SNP disappeared (C3, orange dots).

