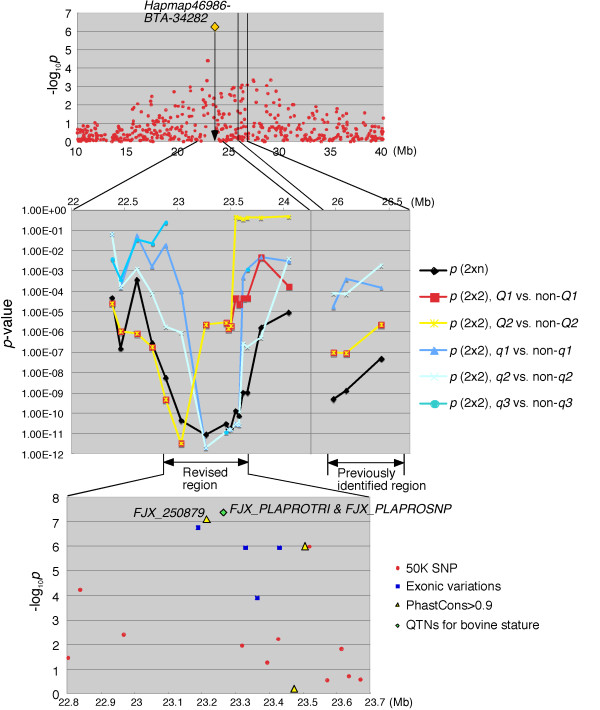
Figure 3.
Linkage disequilibrium mapping ofCW-1and association analysis of the candidate QTN screened by targeted resequencing. Of the 1156 steers used for GWAS, 142 with heavy carcass weight and 145 with light carcass weight were used. Also in this population, Hapmap46986-BTA-34282 was the most associated on BTA 14 (upper panel). Linkage disequilibrium mapping was performed using high-density microsatellites around Hapmap46986-BTA-34282 and the previously identified CW-1 region. A haplotype frequency with two contiguous microsatellites was estimated using an expectation-maximization algorithm in each group and differences in haplotype frequencies between the groups were tested by Fisher’s exact test using a 2xn or a 2x2 contingency table (middle panel). The frequency of the q3 haplotype was very low (< 6 alleles in both groups) in some regions, in which the association of the haplotype was not tested. Targeted resequencing was performed on the revised CW-1 region. Candidate QTN were obtained as described in the text. An association of candidate QTN with carcass weight was examined using EMMAX software [13] (lower panel).

