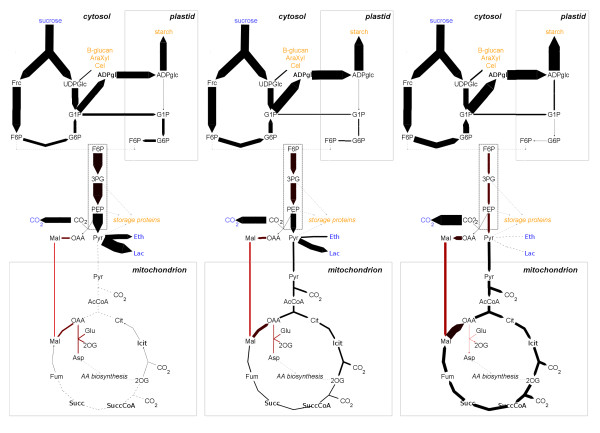
Figure 6.
Flux balance analysis in barley seed metabolism. Mass flux maps depicting fluxes within central barley seed metabolism during the anoxic phase (left), the hypoxic phase (middle) and the aerobic phase (right). Metabolites taken up or excreted by the model are highlighted in blue. Metabolites incorporated into biomass are highlighted in orange. Red graduation indicates high flux variability. Note, that mass flux maps are not balanced.

