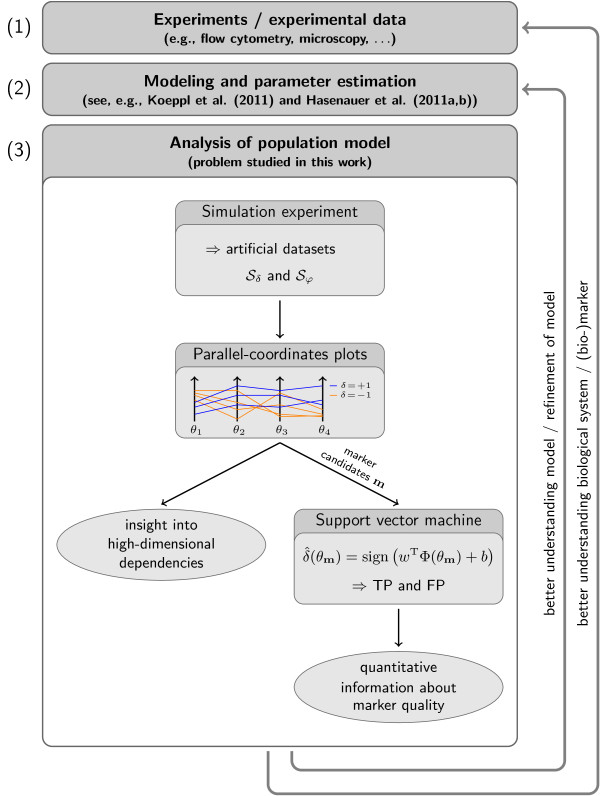
Figure 1.
Visual analytics for marker selection. Illustration of the overall workflow of (1) experiments and the collection of measurement data, (2) modeling and parameter estimation, and (3) model analysis. Our visual analytics framework for marker selection in models of heterogeneous cell populations is shown in detail. Based on simulation data and generated from the model, a visual analysis is performed using parallel-coordinates plots. Employing this visualization, insight can be gained into the dependencies of the considered properties on the parameters. Additionally, a potential marker combination m can be selected, here, for instance, m = 1 or m = 4, which allow for a separation of the classes. For the quantitative assessment of the informativeness of θm, e.g., SV classification or SV regression, may be employed.

