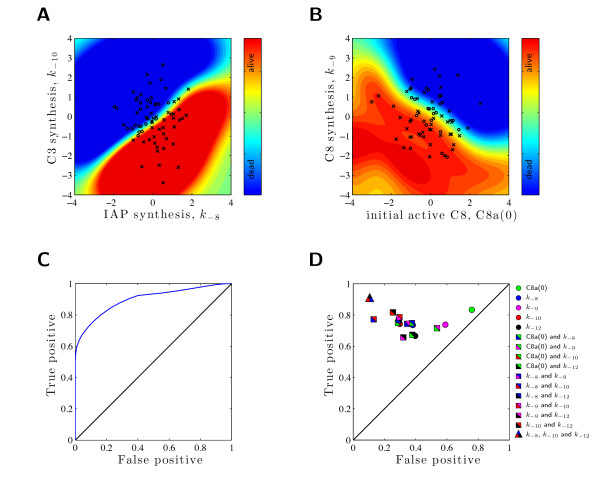
Figure 6.
Performance of different marker combinations. Evaluation of classification performance using different marker combinations. (A) and (B) illustrate the classification obtained using to different two marker combinations. The prediction of the classifier (trained using 10.000 simulations) is provided as background color (blue square = alive; red square = dead) together with a test sample (× = alive; ◦ = dead), which has not been used for training. (A) Classification employing C3 synthesis, k-10, and IAP synthesis, k-8, as markers. For the classification of cell survival: TP = 0.77, FP = 0.13. (B) Classification employing initial amount of C8a, C8a(0), and C8 synthesis, k-8, as markers. For the classification of cell survival: TP = 0.68, FP = 0.53. (C) ROC curve obtained when using C3 synthesis, k-10, and IAP synthesis, k-8 as marker. (D) The performance of all individual markers, all marker pairs, and the best marker triplet in ROC space. Note that an optimal classifier would be in the upper left corner.

