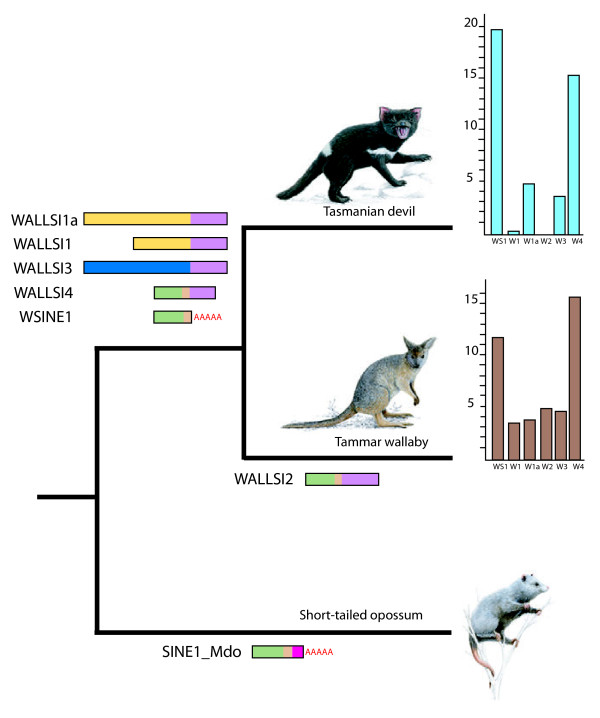
Figure 1.

Distributions of CORE-SINEs and the RTE-propagated WALLSIs across Australian marsupials. The horizontal diagrams represent schematic retroposon structures. Light green: tRNA CORE-SINE with a beige CORE sequence, red As: poly(A)-tail for propagation via LINE1, purple: RTE-tail, yellow, dark blue, and pink: retroposon-specific sequences. In the plots to the right, each bar indicates numbers of copies in 10,000s. WS1:WSINE1; W1:WALLSI1; W1a: WALLSI1a; W2: WALLSI2; W3: WALLSI3; W4:WALLSI4.
