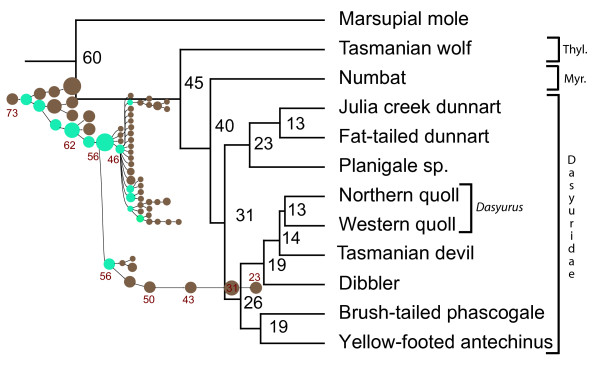
Figure 4.
Phylogeny of Dasyuromorphia based on complete mt genomes. Phylogenomic relationships among dasyuromorphian subfamilies, including the position of the Tasmanian devil, based on complete mitochondrial genomes. The numbers in black at the nodes of the tree are divergence times calculated from a 44-taxon matrix using a combined set of 13 fossil calibration points. The circles plotted beside the tree are the results of a COSEG analysis of the 66 subfamilies of WSINE1. Brown circles indicate different subfamilies and blue circles the subfamilies that gave rise to new subfamilies. The red numbers beside the circles indicate the estimated evolutionary age for selected subfamilies. Thyl: Thylacinidae; Myr: Myrmecobiidae.

