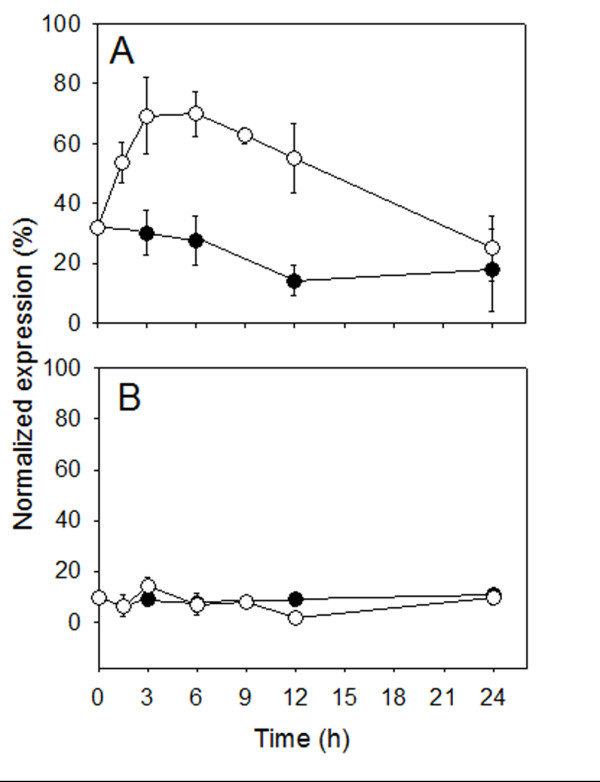
Figure 9.

Expression analyses of genes coding for NRT2 in cucumber roots (A) and leaves (B). The plants were treated as described in the legend of Figure 4. Black circles, control (N-deprived plants without nitrate treatment); white circles, N-deprived plants treated with 4 mM nitrate. Relative expression of NRT2 gene was analyzed by real-time RT-PCR. Data processing reported in the legend of Figure 8.
