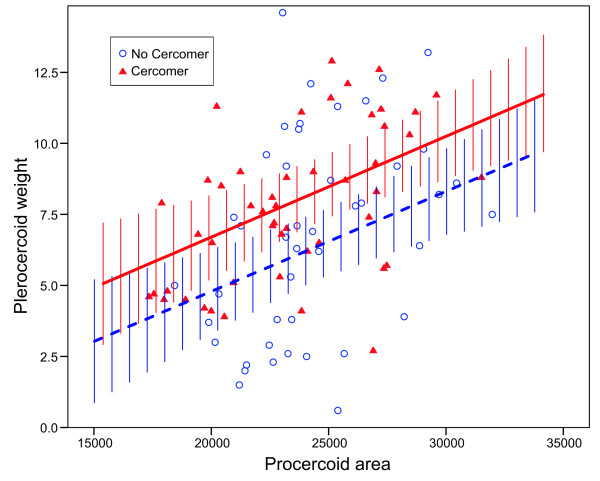
Figure 4.
The relationship between procercoid area (um2) in copepods and plerocercoid weight (mg) in fish. The best fit regression, estimated by the general linear model with just main-effects, was plotted separately for procercoids that did (filled triangles, solid line) and did not (open circles, dashed line) have a cercomer after 9 days in copepods. Bars around regression lines are the 95% CI.

