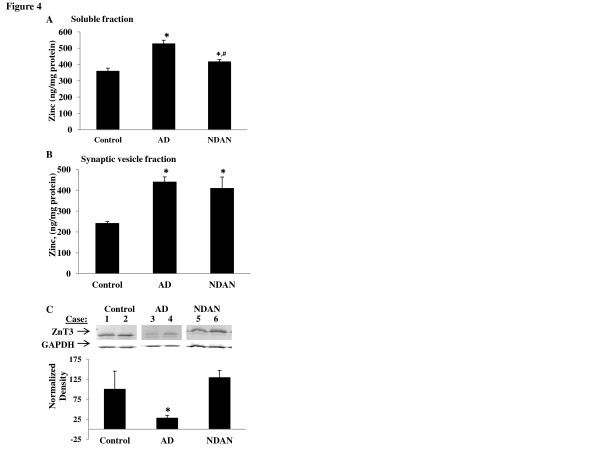
Figure 4.
Differentially altered levels of total Zn2+, releasable Zn2+, and ZnT3 expression in AD and NDAN hippocampus. (A) Soluble hippocampal fractions were normalized for protein (500 μg), digested with hydrogen peroxide and nitric acid, and analyzed using a GF-AAS. Zn2+ levels in both AD and NDAN samples were increased as compared to control, but NDAN Zn2+ levels were significantly lower than AD levels. After a Bonferroni correction, ANOVA results show p = < 0.001, n = 9–10 samples per group. (B) Zn2+ analysis in synaptic vesicles shows that the Zn2+ concentration in AD and NDAN is significantly higher than control (p = < 0.001 (after Bonferroni correction), n = 6–9 per group). (C) Representative Western blot and densitometric analysis (D) of ZnT3 expression in the hippocampus of individual cases shows a significant decrease in AD, but not in NDAN samples, which is denoted by an asterisk (t-test, p < 0.001 n = 6–9 per group, repeated 4 times)

