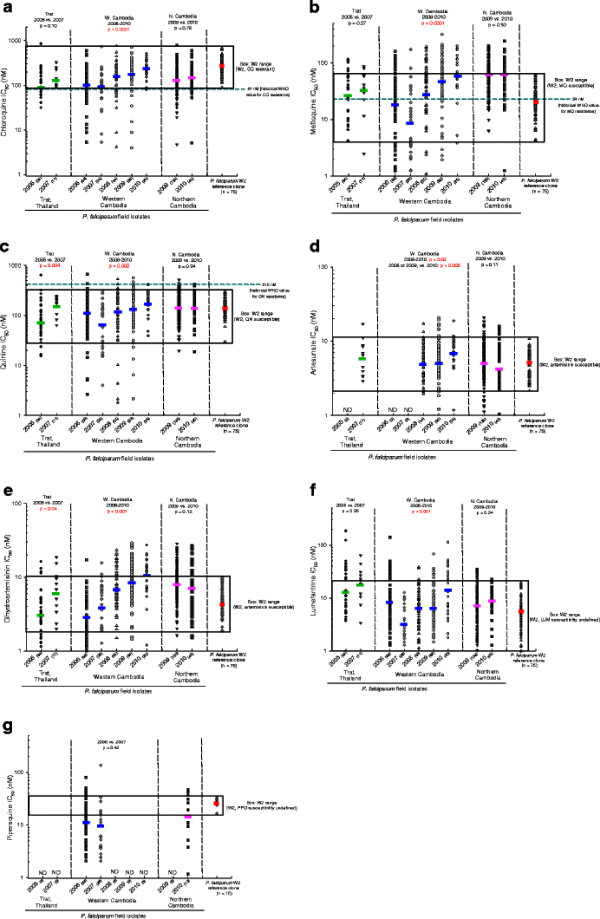
Figure 2.
(a-g):In vitroHRP-2,P. falciparumfield isolate IC50values (nM), determined by HRP-2 against 7 drugs shown as a scatter plots, with geometric mean (GM; solid color bars), by year and region. Sample numbers, in parentheses, are next to each year. P values at top of graphs determined by Mann–Whitney (2 groups) or Kruskal-Wallis. (> 2 groups) tests; p < 0.05 in red. P. falciparum W2 reference clone values for each drug shown at far right (GM, solid red bars); boxes denote ranges. Dashed horizontal lines (green) on CQ, MQ and QN graphs represent approximate historical. IC50 values, denoting clinical “resistance”. nM = nanomolar. ND = not done.

