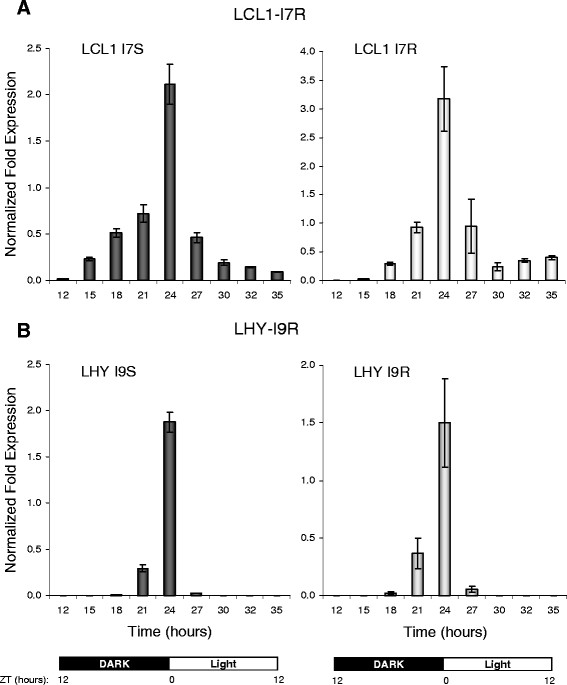
Figure 3.
Oscillating profiles of IR events inLHYandLCL1are regulated by photoperiodic conditions with expression peaks at dark/light transitions under constant temperature (20 °C).LHY-I9S and LHY-I9R transcripts correspond to those with spliced and retained intron 9 events, respectively. LCL1-I7S and LCL1-I7R are transcripts with spliced and retained intron 7 events, respectively. The sampling and diurnal conditions are described in Methods. The normalized fold change in expression was calculated using a –ΔΔCt method and the CFX Manager software as described in Methods.

