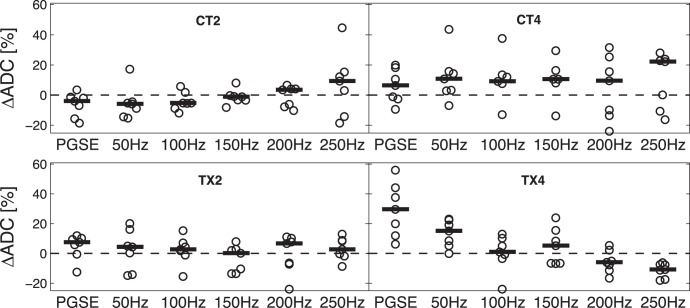
Figure 4. The percentage change of ADC values of all four imaging groups measured by both the PGSE and OGSE method (50–250 Hz).
CT2 and CT4 are 2- and 4-day control groups; and TX2 and TX4 are 2- and 4-day treatment groups. All data points are shown as circles and solid lines indicate the mean percentage change of ADC values at each frequency in each group.

