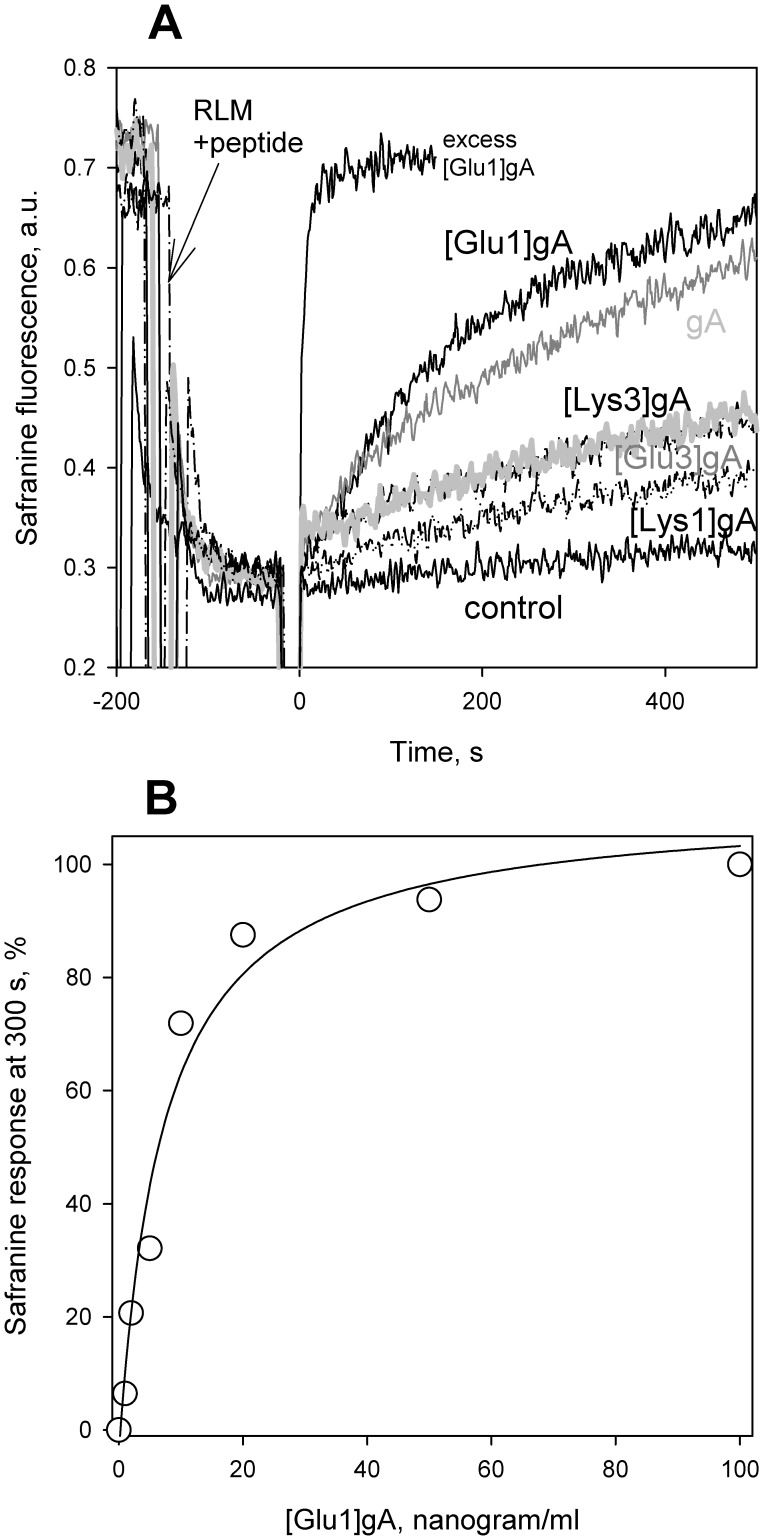
Figure 1. Effect of different peptides on the membrane potential of rat liver mitochondria measured by safranine O.
Panel A. Shown are traces of fluorescence in the medium described in “Materials and Methods.” In all traces, 5 mM of succinate and 1 µM of rotenone were supplemented about 150 s before the addition of a peptide at t = 0 s. Control, no other additions. gA, [Glu1]gA, [Glu3]gA, [Lys1]gA, and [Lys3]gA show traces after the addition of 5 nM (i.e. about 10 nanogram/ml) of a corresponding peptide at t = 0 s. Trace “excess [Glu1]gA” was measured with 1 µg/ml peptide. Panel B. Dose dependence of the effect of [Glu1]gA on mitochondrial membrane potential.

