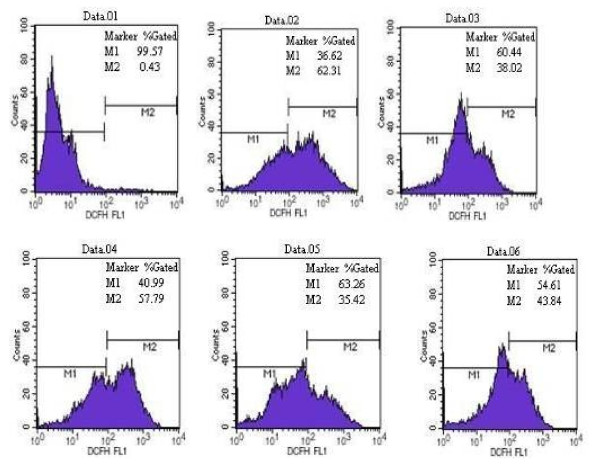
Figure 2.
EGCG attenuates intracellular ROS production after MPP+-induced oxidative stress. PC12 cells were treated as indicated by the various groups. Data. 01: negative control, control group without DCFH-DA; Data.02: positive control, control group with DCFH-DA and rosup; Data.03: control group with DCFH-DA; Data.04: 500 μM MPP+; Data.05: 10 μM EGCG; Data.06: 500 μM MPP+ and EGCG 10 μM. Intracellular ROS production was determined by DCFH-DA fluorescence.

