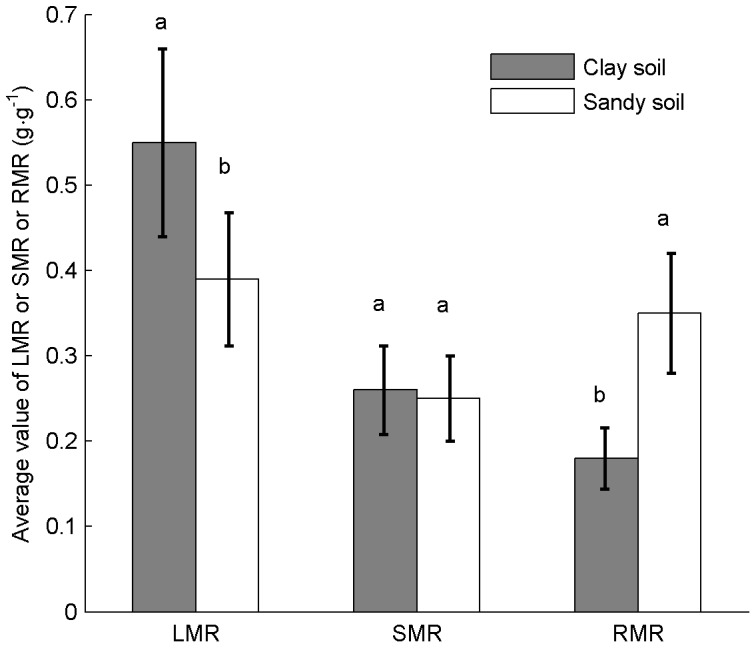
Figure 4. Average values of LMR, SMR and RMR in the two soils over ontogeny.

Bars represent average values ± CV, n = 60. Different letters indicate differences (p≤0.05) of biomass allocation to leaves, stems and roots between the two soils.

Bars represent average values ± CV, n = 60. Different letters indicate differences (p≤0.05) of biomass allocation to leaves, stems and roots between the two soils.