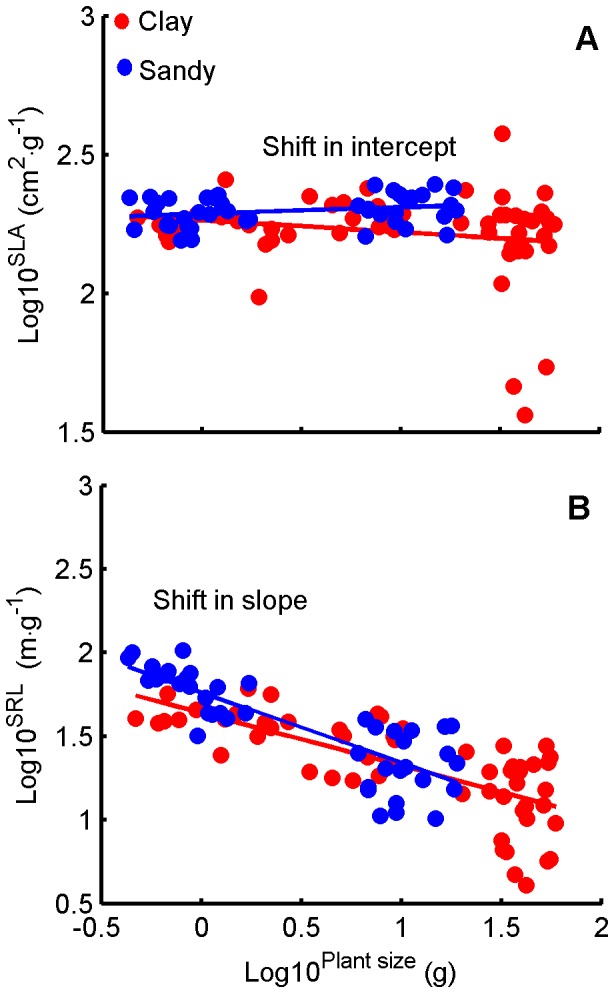
Figure 8. Relationships between plant size and SLA, SRL in the two soil textures.

(A) SLA vs. plant size. (B) SRL vs. plant size. Data for individual slopes and intercepts are given in Table 1. The SMA regression (using SMATR package of R) was used to test the slope and intercept heterogeneity at α = 0.05 (where slopes or intercepts non-heterogeneous, P>0.05) between the two soil textures: (A) Slopes non-heterogeneous, P = 0.12; Intercepts heterogeneous: SLA lower at a given plant size in clay soil treatment (P<0.001). (B) Slopes non-heterogeneous, P = 0.28; Intercepts non-heterogeneous: SRL was equal at a given plant size between clay and sandy soil treatment (P = 0.77).
