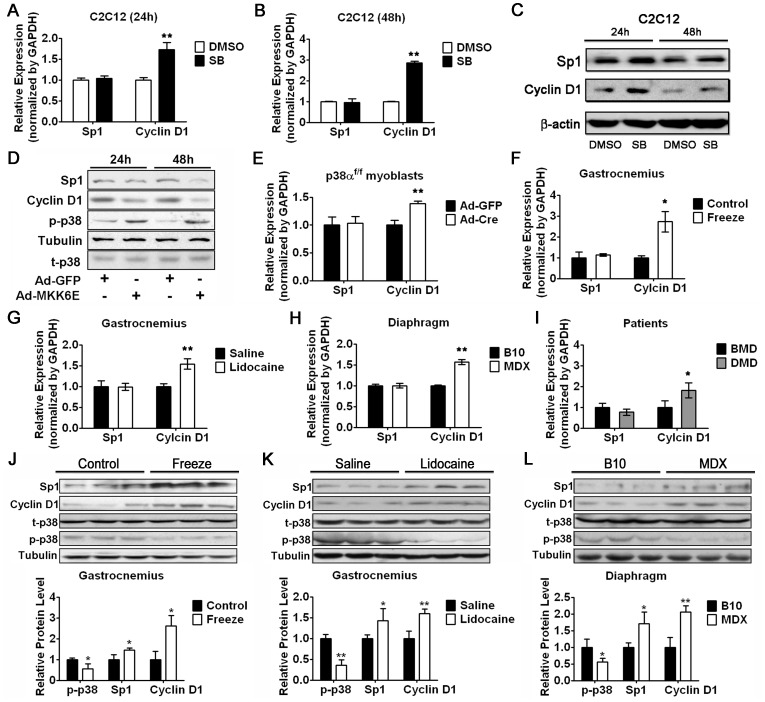
Figure 6. Sp1 and Cylin D1 expression are downregulated during Early Phase of Muscle Regeneration.
(A and B) Real-time RT-PCR analysis of Sp1 and Cyclin D1 mRNA expression in C2C12 myoblasts treated with SB203580 or DMSO as a control for 24 hours (A) or 48 hours (B) as indicated. Error bars represent the SD of three independent experiments. (C) Western blot analysis of Sp1 and Cyclin D1 protein expression in C2C12 myoblasts treated with SB203580 or DMSO as a control for 24 hours or 48 hours as indicated. (D) Western blot analysis of Sp1, Cyclin D1 and p-p38 protein level in C2C12 myoblasts infected with Ad-MKK6E or Ad-GFP as a control for 24 hours or 48 hours as indicated. (E) Real-time RT-PCR analysis of Sp1 and Cyclin D1 mRNA expression in p38αf/f myoblasts infected with Ad-Cre or Ad-GFP as a control as indicated. Error bars represent the SD of three independent experiments. (F–I) Real-time RT-PCR analysis of the expression of Sp1 and Cyclin D1 in GAS muscle of mice following freeze injury (F), in GAS muscle of mice following lidocaine injection (G), in Diaphragm muscle of mdx mice (H), in skeletal muscle of patients with BMD or DMD (I). SDs are shown as error bars (n≥3). (J–L) Western blot analysis of Sp1, Cyclin D1, and p-p38 in muscle regeneration mouse models, including freeze injury model (J), lidocaine injury model (K), and mdx mouse model (L). The relative intensity of each band was quantified with NIH image. Tubulin and t-p38 were used for normalization for Sp1/Cyclin D1, and p-p38 respectively. SDs are shown as error bars (n = 3). *p<0.05, **p<0.01.

