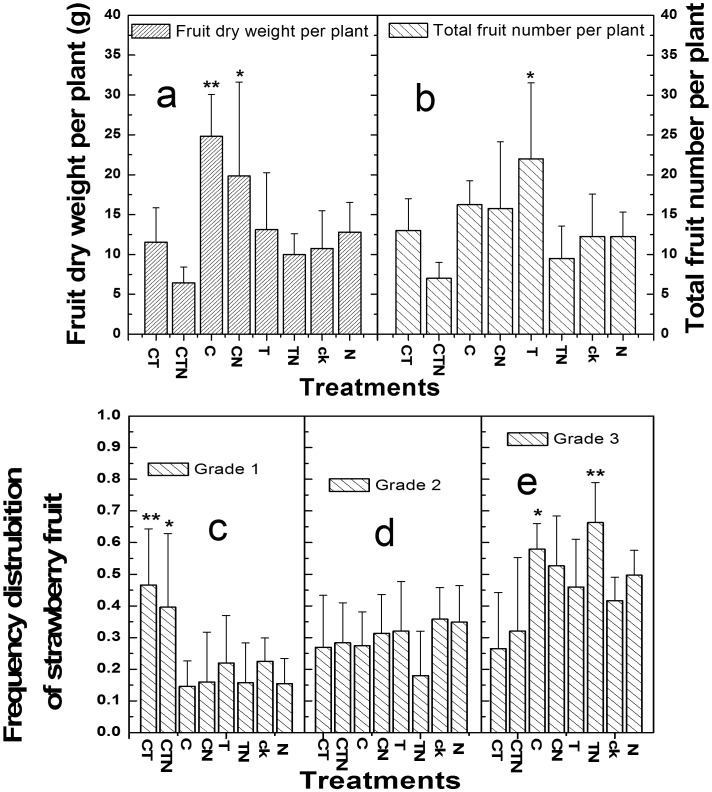
Figure 1. Total fruit dry weight (a), total fruit number (b) and fruit grades (c, d, e) of strawberry plants cultivated under different conditions (mean ± SD, n = 4).
The berries were graded in three size classes depending on fruit dry weight (FDW; FDW <0.4 g, grade 1; 0.4≤ FDW ≤0.7 g, grade 2; FDW >0.7 g, grade 3). The frequency distribution of grade 1, 2 and 3 is showed in figures c, d and e, respectively. Bars indicate standard deviation, while * and ** indicate significant differences at P<0.05 and 0.01, respectively.

