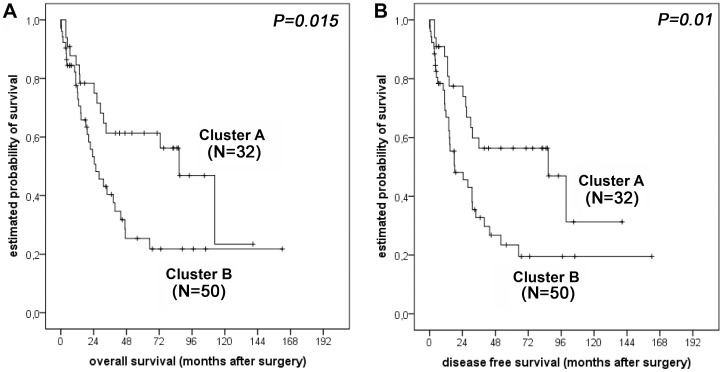
Figure 3. Survival analysis for oesophageal adenocarcinoma patients.
Kaplan-Meier survival curves for 82 patients from Clusters A and B with respect to overall survival (A) and disease-free survival (B). Patients who died within the first month after surgery (N = 5) were excluded from the survival analysis.

