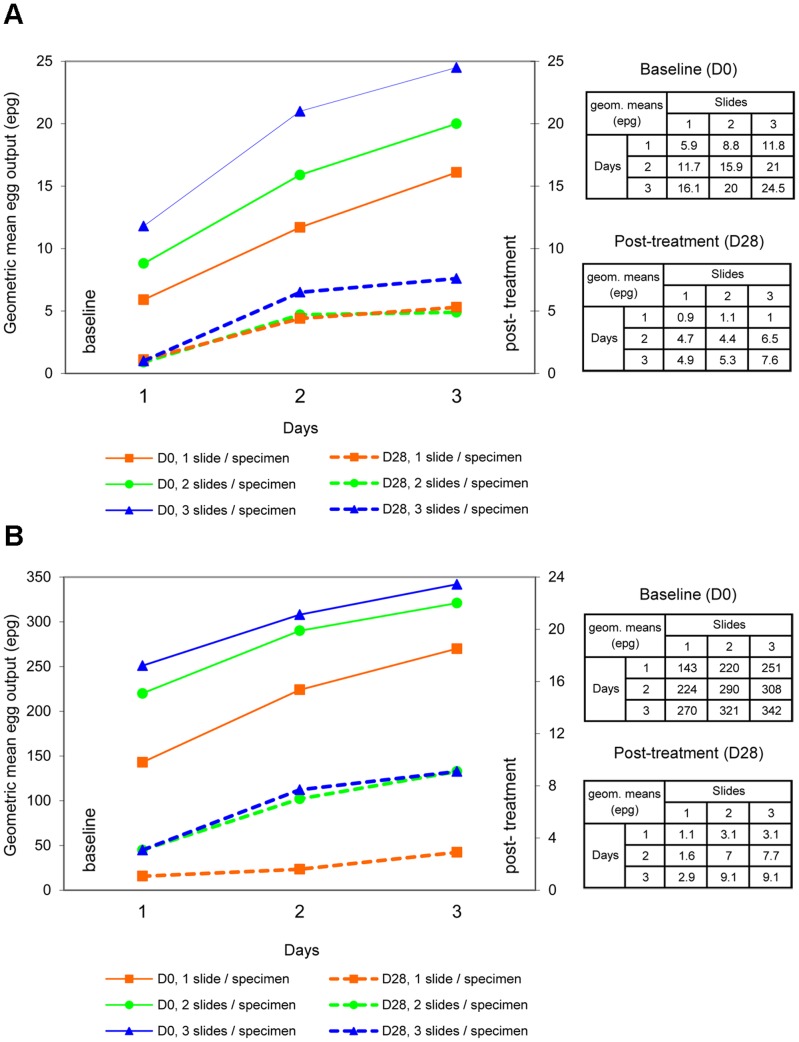
Figure 3. Geometric mean fecal egg counts according to the sampling effort.
Geometric mean fecal egg counts before and after PZQ treatment, by the number of days of stool specimen collection (x-axis), based on children diagnosed “infected” following maximum Kato-Katz thick smear sampling effort. (a) S. mekongi infected at baseline (day 0), n = 79; days 28–30 after treatment, n = 14; and (b) O. viverrini infected at baseline (day 0), n = 89; days 28–30 after treatment, n = 11. Each point on a curve represents the geometric mean fecal egg count for each sampling effort (number of Kato-Katz thick smears examined per stool specimen).

