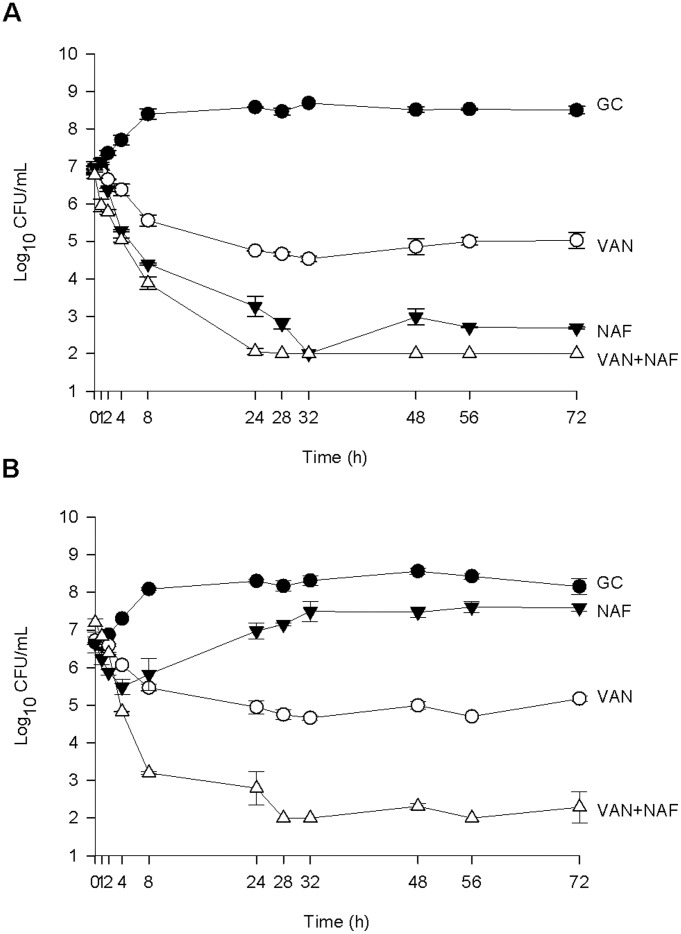
Figure 4. Activity of vancomycin and nafcillin alone and in combination in the PK/PD model against one MSSA isolate (SNL9) (A) and one MRSA isolate (SNL96) (B).
Data are presented as a graph of the mean bacteria remaining vs. time with error bars at the sampling points representing 1 standard deviation from the mean. GC = Growth Control, NAF = Nafcillin, VAN = Vancomycin.

