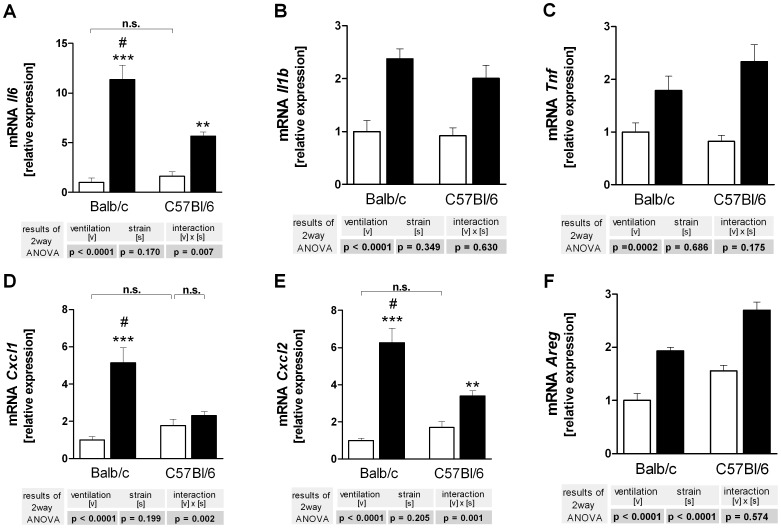
Figure 4. Gene expression of cytokines (A–C), chemokines (D,E) and amphiregulin (F) in C57BL/6 and BALB/c mice.
Right lungs were harvested after 240 min of ventilation and perfusion and probed by RT-qPCR for Il6 (A), Il1b (B), Tnf (C), Cxcl1 (D), Cxcl2 (E) and Areg (E). LPV, white bars; HPV, black bars. Data are mean + SEM with n = 6 per study group. Two way ANOVA was performed and only if a significant intercept (strain × ventilation) was detected, it was followed by individual comparisons (*P<0.05; **P<0.01; ***P<0.001 vs. LPV; #P<0.01 vs. C57BL/6).

