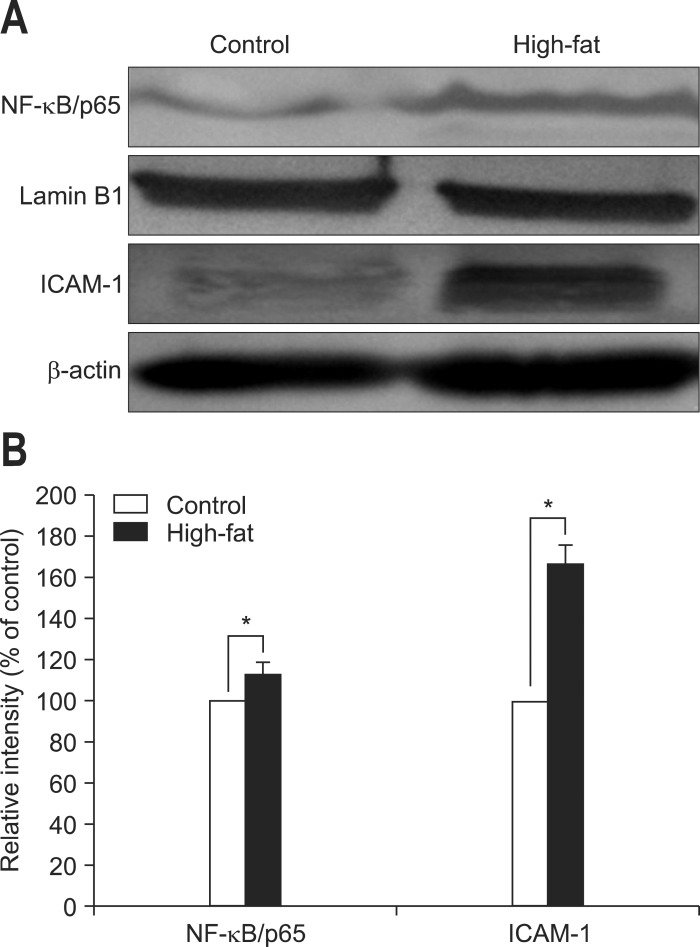
Fig. 4.
Protein expression in pancreatic samples. (A) Western blots displaying the expression of intra-nuclear protein nuclear factor kappa B (NF-κB)/p65 and cytosolic protein intercellular adhesion molecule 1 (ICAM-1). A representative image from three experiments is displayed. (B) The relative intensity of the Western blot bands was analyzed using ImageJ software. The data are expressed as percentages of the control values. Data are presented as means±SD. Control, n=10; High-fat, n=12.
*p<0.001, control versus high-fat diet.

