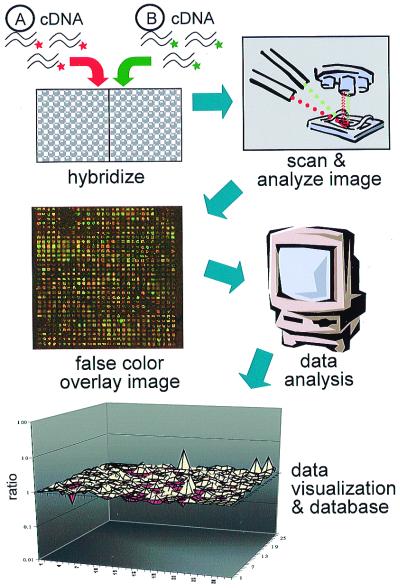
Figure 1.
Microarray experimental schema. cDNA-synthesized RNA from two samples, A and B, is simultaneously hybridized onto a spotted ordered array of cDNA clones. Each sample is labeled with fluors that emit at different wavelengths so that signal from each sample can be distinguished. On the false color image depicted, red signals represent stronger Sample A hybridization, and green signals represent stronger Sample B hybridization or relative enrichment. Yellow spots indicate equal abundance in both samples, and a yellow signal is observed in control nondifferentially expressed spots (group of four in lower left-hand corner). A three-dimensional matrix plot of gene expression data is depicted simply to illustrate one form of analysis and data visualization. The highest peaks represent the most differentially expressed genes. Sandberg et al. (3) use the genechip oligonucleotide array system (Affymetrix, Santa Clara, CA), in which samples are hybridized individually onto separate arrays, and interarray comparisons are made by using a global scaling factor that normalizes by scaling to the average signal intensity on each array. The term “probe” refers to the DNA attached to the array surface and the term “target” to the cDNA that is hybridized onto the array. Radioactive targets may be used as well, and each system has advantages and disadvantages in terms of cost, sample preparation, ease of use, and reproducibility.

