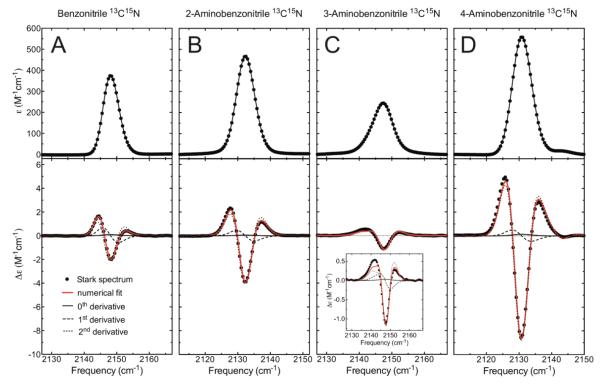
Figure 2.
Absorbance and Stark spectra of isotopically labeled (A) BN, (B) 2-ABN, (C) 3-ABN, and (D) 4-ABN. The top and bottom panels show the absorbance and Stark spectra, respectively, measured at a concentration of 100 mM at 77K in 2-methyltetrahydrofuran. All spectra were scaled to M−1 cm−1 (typical absorbance values were ~0.1), and the Stark spectra were additionally scaled to 1.0 MV/cm applied field (typical experimental applied fields were 0.7-1.0 MV/cm), so that the spectra can be directly compared. The red lines in the Stark panels show the numerical fits to the Stark data, consisting of the sum of contributions from the 0th, 1st, and 2nd derivatives of the absorption, and the thin lines show the individual contributions of each derivative. The linear Stark tuning rate is proportional to the square root of the 2nd-derivative contribution17,30.

