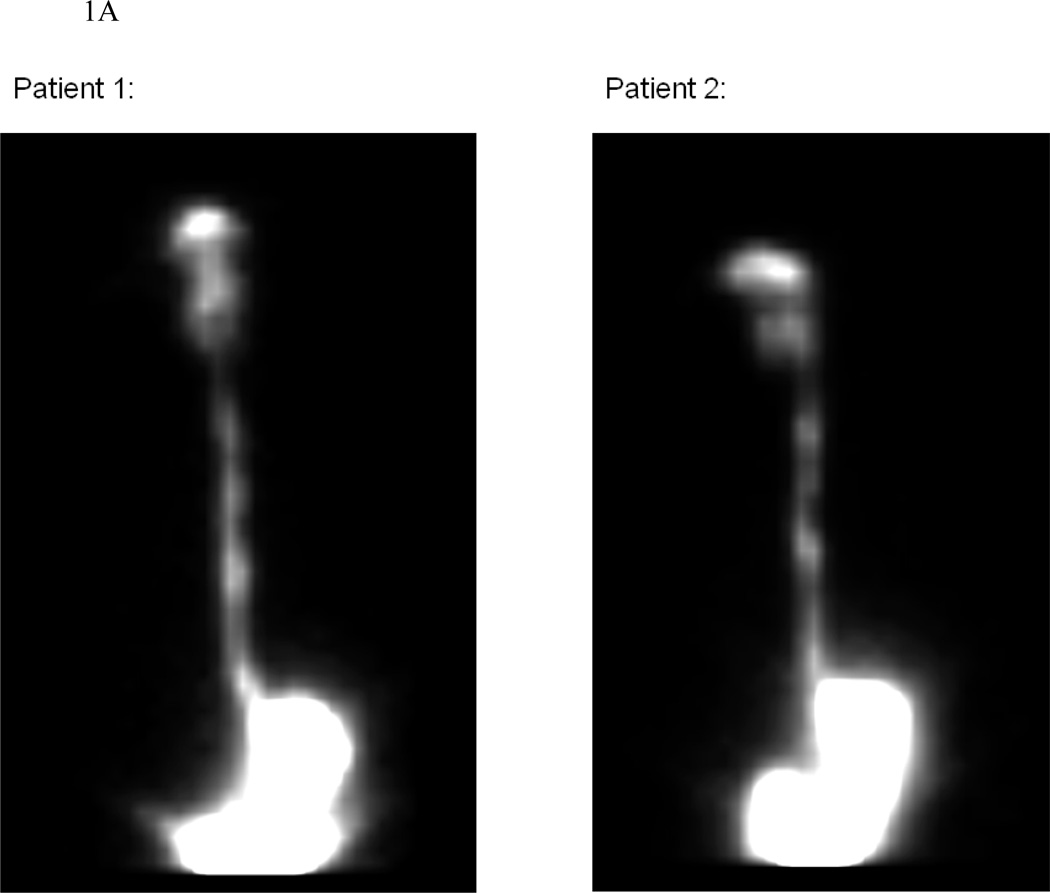
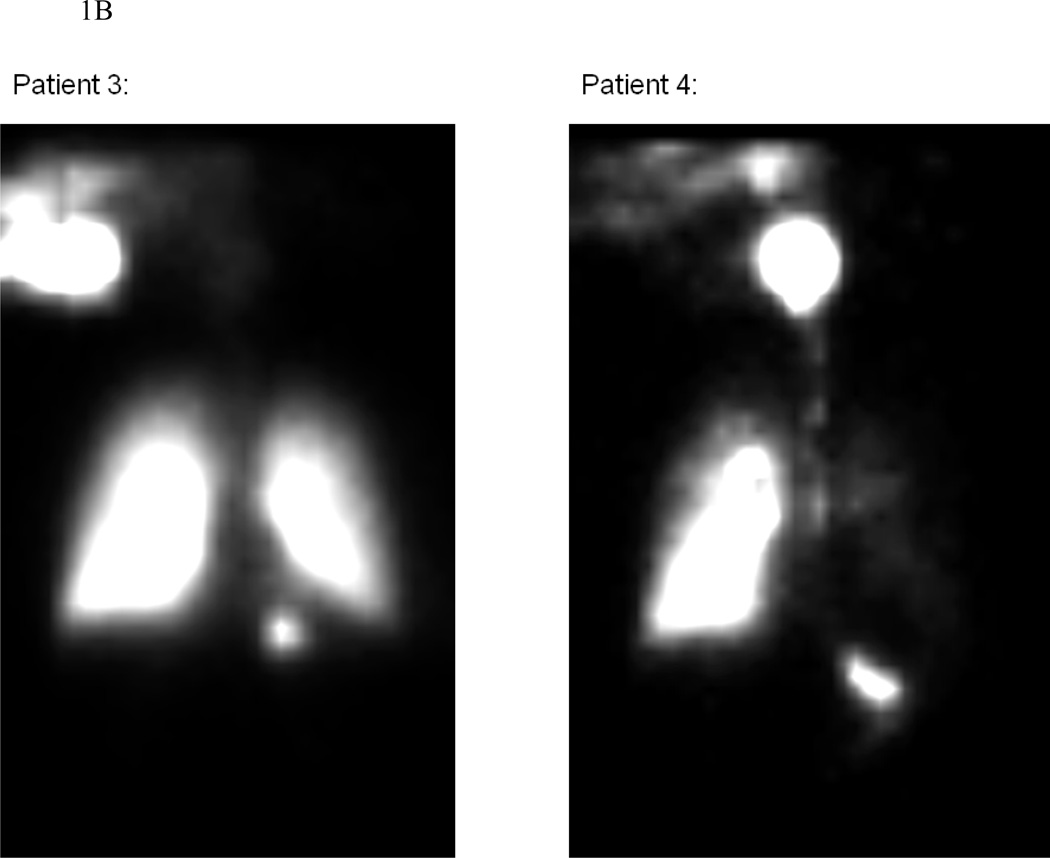
Figure 1.
Illustrative examples of nuclear scintigraphy esophageal emptying scans for the OVB (panel A) and NEB (panel B) groups. These images represent the total distribution of 99mTc-DTPA tracer throughout the imaging period. Note that for OVB, the medication deposit only in the oropharynx, esophagus and stomach, while for NEB there is also medication deposition in the lungs. In addition, there is qualitatively more deposition in the esophagus and stomach of OVB compared with NEB.


