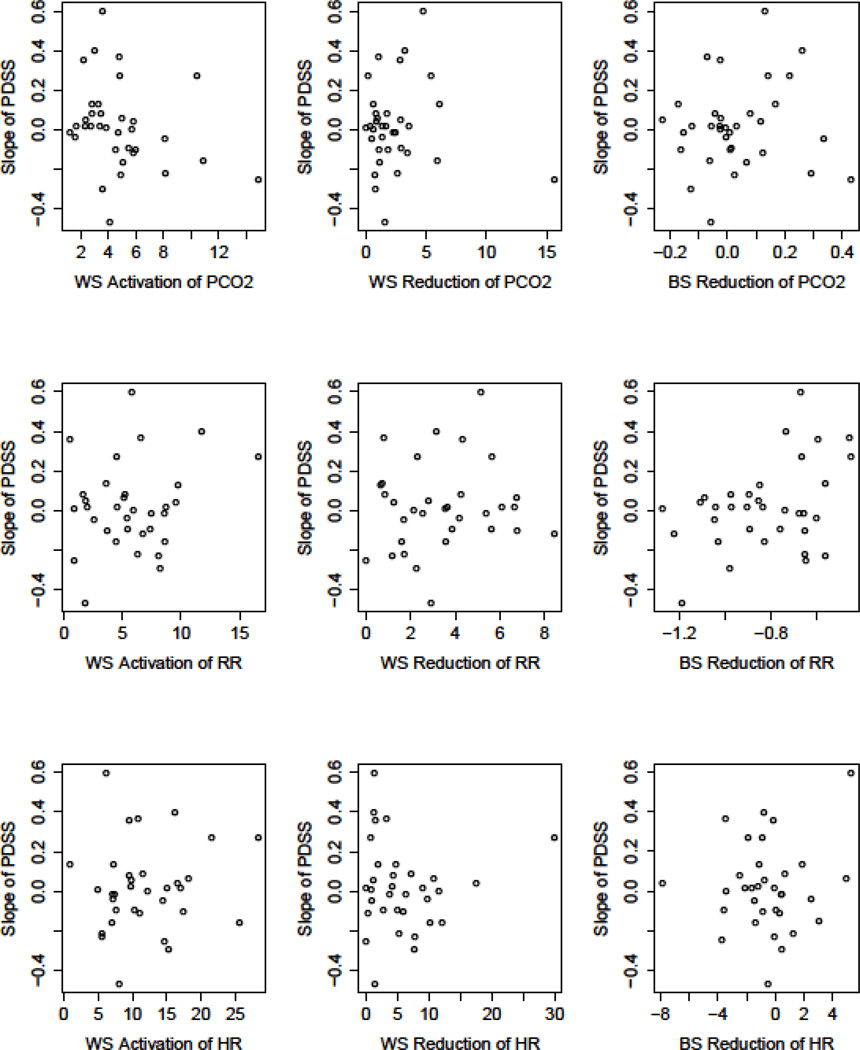
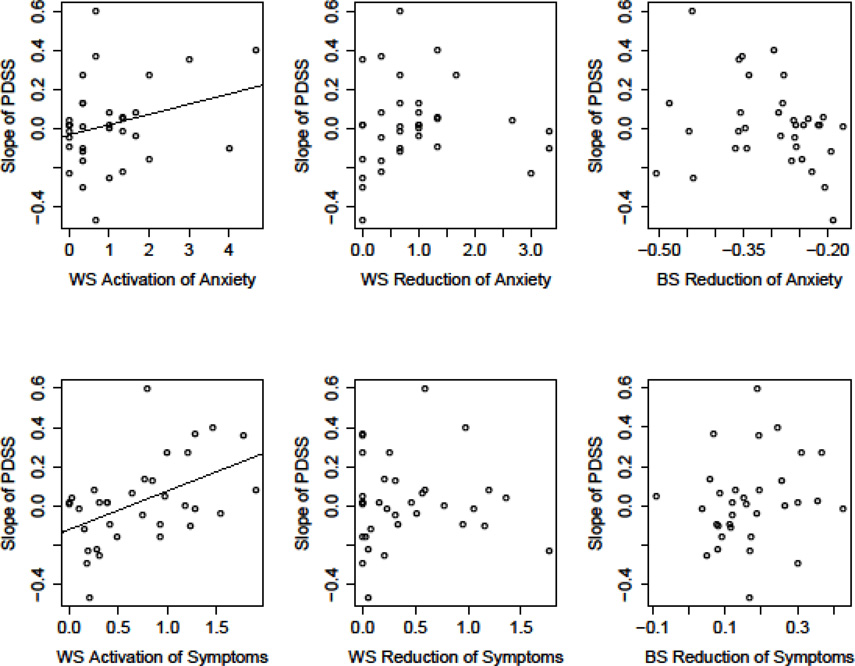
Figure 1.
Scatterplots depicting the predictive value of physiological (PCO2, RR, HR) and experiential (anxiety, DSM-IV panic symptoms) reactivity on panic symptom severity (PDSS) reductions. Slope of PDSS (on y-axis) represents the slope of change from pre –through follow-up. Values for fear reactivity (x-axis) represent average change for within session (WS) activation (peak minus baseline), WS reduction (peak minus recovery), and between-session (BS) reduction (slope of peak levels across session). Calculations for PCO2 were reversed since higher numbers for PCO2 reflect lesser (not greater) pathology. Only the relations between anxiety and DSM-IV symptoms with reductions in PDSS were significant (p≤.01; indicated as regression line).


