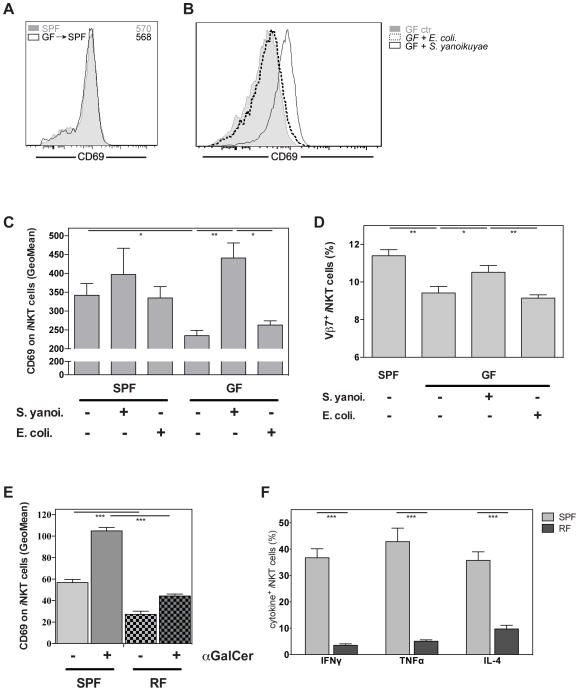
Figure 5. Bacterial exposure corrects the hyporesponsive phenotype of iNKT cells.
(A) GF and SPF housed Swiss Webster mice were co-housed for four weeks and expression of CD69 in splenic iNKT cells was analyzed. The numbers in histograms denote the geometric mean values for CD69 on iNKT cells. (B–D) GF and SPF housed Swiss Webster mice were mock treated or intra-gastrically challenged with either S. yanoikuyae or E. coli bacteria as indicated. Four to five days later the expression of CD69 in splenic iNKT cells was analyzed and is represented as example histogram (B) or as summary (C). Furthermore, the relative frequency of Vβ7+ iNKT cells is shown (D). (E, F) Expression of CD69 (E) and indicated cytokines (F) by splenic iNKT cells from restricted-flora (RF) and SPF housed C57BL/6 mice with or without αGalCer challenge in vivo (90min). Representative data from two (A, E, F), three (D) or four (B, C) independent experiments are shown.

