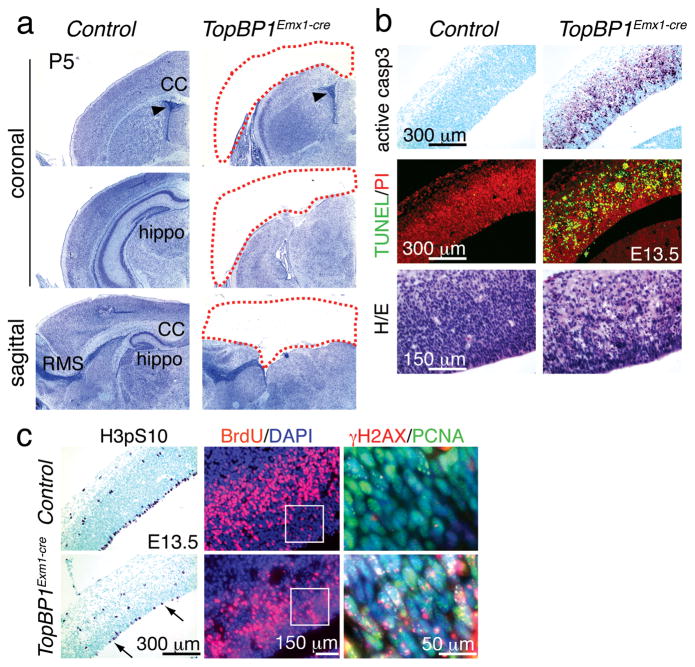
Figure 3. Dorsal telencephalon progenitors are lost in TopBP1Emx1-cre mice.
(a) Cortices and other structures developing from the dorsal telencephalon are missing in the TopBP1Emx1-cre brain; shown by Nissl staining at P5. CC is the corpus callosum, hippo is the hippocampus and RMS is the rostral migratory stream. (b) Abundant apoptosis is observed in the E13.5 TopBP1Emx1-cre neopallial cortex shown using TUNEL and activated caspase-3 staining. Differences in the numbers of apoptotic cells between genotypes calculated using a student’s t-test were significantly different; active caspase 3 positive cells in 1 mm2 (± SEM) were; control = 0; TopBP1Emx1-cre = 734.5 (± 30.58), and TUNEL positive cells in 1 mm2 (± SEM) were; control = 7 (± 0.81) and TopBP1Emx1-cre = 987.5 (± 27.381). (c) Fewer proliferating cells indicated by histone H3pSer10 or BrdU incorporation staining are seen in the E13.5 TopBP1Emx1-cre neopallial cortex. Differences in the numbers of proliferating cells between genotypes calculated using a t-test were significantly different; BrdU positive cells in 0.27 mm2 (± SEM) were; control = 438.4 (±26.48) TopBP1Emx1-cre = 205.6 (± 10.31) and H3pS10 positive cells in 1 mm2 (± SEM) were; control = 91 (± 4.589), TopBP1Emx1-cre = 27.69 (± 1.707). Widespread DNA damage shown by γH2AX and PCNA immunostaining in regions indicated in white boxes in adjacent panels.

