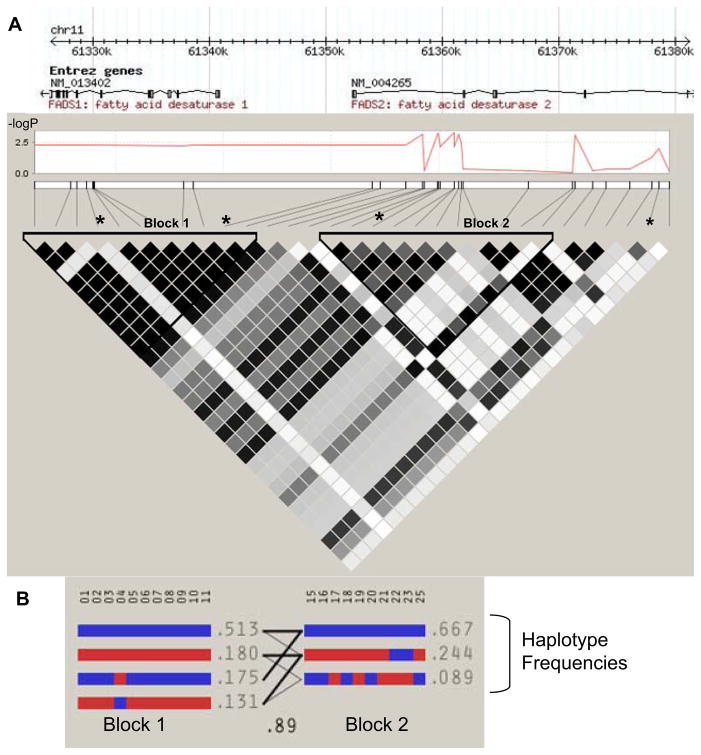
Figure 1. Expression quantitative trait locus in FADS2 intron 1 and associated haplotype blocks in the Japanese HapMap population.
(A) A Manhattan plot of -log(p-value) vs. distance in Kb is shown for the association of individual SNPs with FADS1 expression, with gene annotations above. Two LD blocks for this population are shown, with darkness of shaded cells representing the degree of correlation (R2) between pairs of SNPs. * Marked SNPs were associated with the ratio of arachidonic to linoleic acid (a measure of apparent total desaturase activity) in other Asian populations [11, 39]. (B) Haplotypes for each LD block are shown, with major alleles for each SNP in blue, and minor alleles in red. Recombination between blocks is depicted by the density of lines connecting individual haplotypes, and the multiallelic D′ (0.89).

