Figure 1.
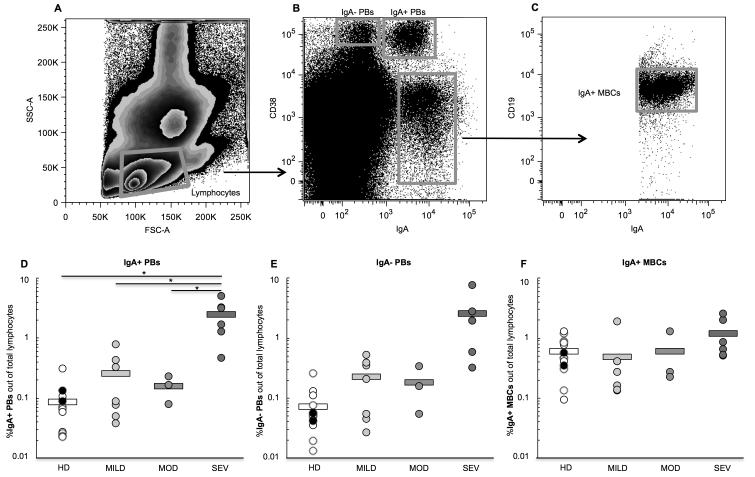
Representative flow cytometry plots of B cell subset gating strategy. From left to right: (A) lymphocytes are gated, (B) three B cell subsets are identified— the IgA−plasmablasts (PBs), the IgA+ PBs, and the IgA+ memory B cells (MBCs), then (C) the IgA+ MBCs are further gated for CD19 expression. The percent of (D) IgA+ PBs, (E) IgA− PBs, and (F) IgA+ MBCs out of total peripheral blood lymphocytes was determined for all healthy donor and pediatric UC patient blood samples. Samples were grouped according to type of donor; groups here are healthy donors (HD) (black dots are pediatric HD, and white dots are adult HD), and pediatric patients with mild UC (MILD), moderate UC (MOD), and severe UC (SEV) disease activity. Circles represent individual samples and bars represent the group’s average. Student’s t-test was performed between all UC patient groups vs. healthy donors, and between the severe group vs. the mild and moderate UC groups. *p<0.05; no asterisk indicates p>0.05. Significance (p<0.05) is present in (E) when the severe patient with the highest percent of IgA− PBs (a high outlier) is removed from the analysis.

