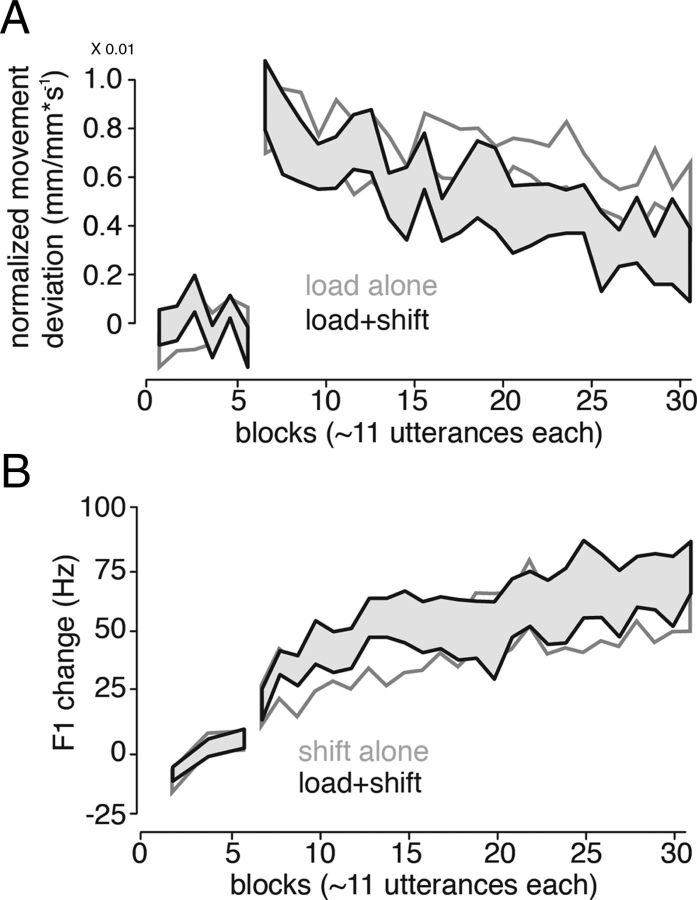
Figure 4.
Applying the perturbations at the same time did not change the amount of compensation for each perturbation. A, Jaw movement deviation over the course of training for the subjects who adapted to the somatosensory perturbation. Curves outlined in gray represent subjects that received just the somatosensory perturbation (Experiment 1). Curves outlined in black represent subjects who received both the somatosensory and auditory perturbations at the same time (Experiment 3). In each case, seven of 14 subjects compensated for the perturbation. Shaded and enclosed regions represent ±1 SE. B, Change in F1 frequency over the course of training for subjects who adapted to the auditory perturbation. Curves outlined in gray show subjects that received just the auditory perturbation (Experiment 2). Curves outlined in black show subjects that received both the auditory and somatosensory perturbations at the same time (Experiment 3). In each case, 11 of 14 subjects compensated for the perturbation.

