Fig. 1.
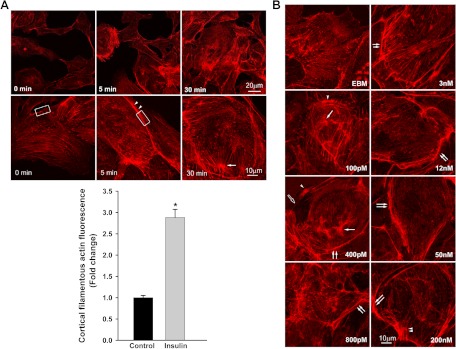
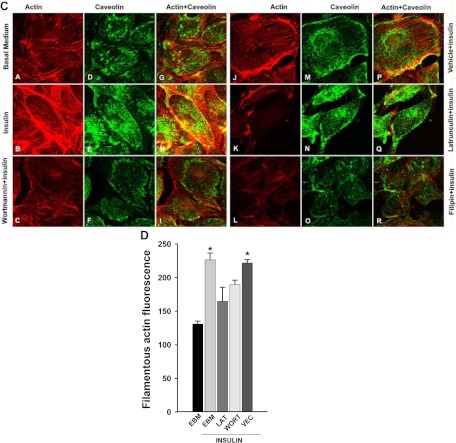
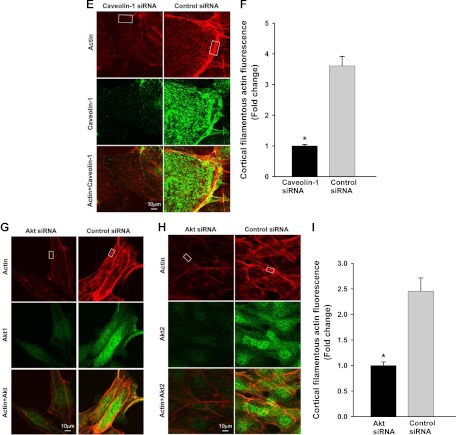
Insulin-induced cortical actin filament remodeling. bAEC were serum starved followed by treatment with insulin, and then cells were fixed and stained with phalloidin-TRITC. A, Representative confocal images of single optical sections reflecting the time course of 50 nm insulin-induced cortical actin filament remodeling; top panel, upper row, lower-magnification representative images; bottom row, higher-magnification representative images. Arrowheads denote the thickened cortical actin filament band, and an arrow denotes a spike-like mesh structure of cortical actin filaments. At 0 min, no insulin was added. Bottom panel, quantification of changes in the fluorescent intensity of F-actin in the cortical region on or near the plasma membrane of bAEC on the higher-magnification confocal images (indicated by the rectangular boxes in the images at 0 and 5 min, respectively) by using Image J software [n = 40 for each group; counting 10 cells randomly selected from either the control (at 0 min, i.e. no insulin added) or insulin-stimulated group (at 5 min after insulin added); the rectangular box was placed on the identifiable cortical regions]. *, P < 0.001 compared with the control group. B, Representative confocal images of single optical sections reflecting the dose response of cortical actin filament remodeling to insulin treatment for 5 min (the insulin dose is indicated in each micrograph). EBM indicates that cells were incubated in basal medium without insulin treatment. A closed arrow denotes the actin filamentous bundle, an open arrow denotes the thinner cortical actin filamentous band, an arrowhead denotes a patch-like structure of cortical actin filaments, and double arrowheads denote a spike-like mesh structure of cortical actin filaments. Double arrows denote thickened cortical actin bands. C and D, Effects of blocking PI3K insulin signaling pathway and interrupting actin filament organization or lipid rafts on insulin-induced cortical actin filament remodeling. C, bAEC were serum starved and then pretreated with either 100 nm wortmannin or 25 nm latrunculin A or 5 μg/ml filipin or vehicle (dimethylsulfoxide) or basal medium (EBM) for 30 min followed by 50 nm insulin treatment for 5 min and then fixed and processed for double staining for caveolin-1 (green, revealed by Cy2) and actin filaments (red, revealed by phalloidin-TRITC). Presented confocal images of single optical sections are representative of three independent experiments. D, bAEC seeded in 96-well plates with the same number of cells were serum starved and then pretreated with either 25 nm latrunculin A (LAT) or 100 nm wortmannin (WORT) or vehicle control (VEC) for 30 min followed by 50 nm insulin treatment for 5 min, and then cells were fixed and stained with phalloidin-TRITC for 45 min before being measured using a fluorescent-detection microplate reader. *, P < 0.05 compared with EBM, LAT, or WORT group, respectively; no significant difference was found between insulin-treated only (EBM+insulin) and VEC+insulin group or between remaining groups. E–I, The effects of knockdown of either caveolin-1 or Akt (both Akt1 and Akt2) on insulin-induced cortical actin filament remodeling; E, representative confocal images of single optical sections after siRNA knockdown of caveolin-1; F, quantification of changes in the fluorescent intensity of F-actin in the cortical region on or near the plasma membrane of bAEC after knockdown of caveolin-1; G and H, representative confocal images of single optical sections after siRNA knockdown of Akt (both Akt1 and Akt2) (G, stained for Akt1 with F-actin; H, stained for Akt2 with F-actin); I, quantification of changes in the fluorescent intensity of F-actin in the cortical region on or near the plasma membrane of bAEC after knockdown of the Akt. The quantitation was made on the confocal images (indicated by the rectangular boxes in the images, and the rectangular box was placed on the identifiable cortical regions) by using Image J software (n = 32 for each group; counting eight cells randomly selected from either the control siRNA-treated or specific siRNA-treated group, respectively). *, P < 0.05 compared with the control siRNA group. Experiments were repeated three times independently.


