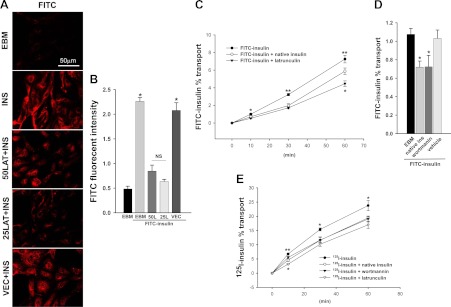
Fig. 2.
A and B, Dose response of FITC-insulin uptake to latrunculin A treatment. The bAEC were serum starved for 6 h and then pretreated with 0 (vehicle) and 25 and 50 nm latrunculin A (LAT or L), respectively, for 30 min followed by incubation with or without 50 nm FITC-insulin (INS) for 30 min. Cells then were fixed and stained using anti-FITC (red, revealed by Cy3) primary antibodies. A, Confocal images from single optical sections. B, The histograms indicate the quantitation of FITC-insulin fluorescence intensity observed in three experiments. *, P < 0.001 compared with EBM (incubated in basal medium without FITC-insulin), 50 nm LAT or 25 nm LAT group, respectively; no significant difference between FITC-insulin (INS)-treated only (EBM+FITC-insulin) and vehicle control (VEC) + FITC-insulin group or between remaining groups). C–E, Effects of either interruption of actin filament organization or blocking PI3K insulin signaling pathway on insulin's TET: time course for the transport of insulin across bAEC cultured on Transwell plates. Cells were exposed to either 1 μm FITC-insulin (C and D) or 200 pm [125I]insulin (E) alone or in the presence of either 2 μm unlabeled insulin or 25 nm latrunculin A (C and E) or 100 nm wortmannin (D and E) or vehicle control (D). C, Time course of percent transport of total added FITC-insulin. *, P < 0.05 compared with remaining groups, respectively; **, P < 0.001 compared with remaining groups, respectively; n = 8. D, Percent transport of total added FITC-insulin at 10 min. *, P < 0.05 compared with the control groups (EBM or vehicle), respectively; no significant difference between EBM and vehicle group; n = 4. E, Time course of percent transport of total added [125I]insulin. *, P < 0.01 compared with remaining groups, respectively; **, P < 0.001 compared with the latrunculin group and P < 0.05 compared with the remaining groups, respectively; n = 3.

