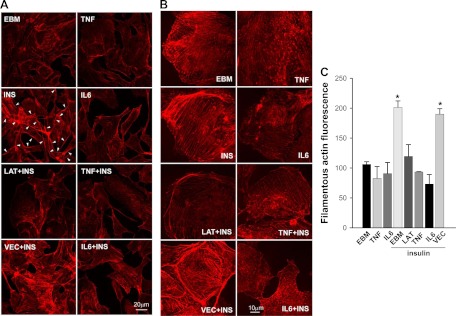
Fig. 4.
The effects of TNFα and IL-6 on insulin-induced cortical actin filament remodeling. The bAEC were serum starved for 24 h with or without TNFα or IL-6 (20 ng/ml) and then pretreated with or without 25 nm latrunclin A (LAT) or vehicle control (VEC) for 30 min followed or not by insulin (INS) treatment for 5 min. Cells were then fixed and stained with phalloidin-TRITC. A, Representative confocal images (single optical sections) at lower magnification. B, Representative confocal images (single optical sections) at higher magnification. Presented images are representative from two independent experiments. Arrowheads denote the insulin-induced cortical filamentous bands on the plasma membrane. For EBM, cells were incubated in basal medium only without insulin. C, The bAEC seeded in 96-well plates with same cell numbers in each well were serum-starved in the absence or presence of TNFα or IL-6 (20 ng/ml, each) for 6 h and then pretreated with either 25 nm latrunculin A (LAT) or vehicle control (VEC) for 30 min followed by 50 nm insulin treatment for 5 min. Cells were then fixed and stained with phalloidin-TRITC for 45 min before being measured using a fluorescent-detection microplate reader. *, P < 0.05 compared with EBM, TNF, IL-6, LAT+insulin, TNF+insulin, or IL-6+insulin group, respectively; no significant differences were seen between insulin-treated only (EBM+insulin) and VEC+insulin group or between the remaining groups.

