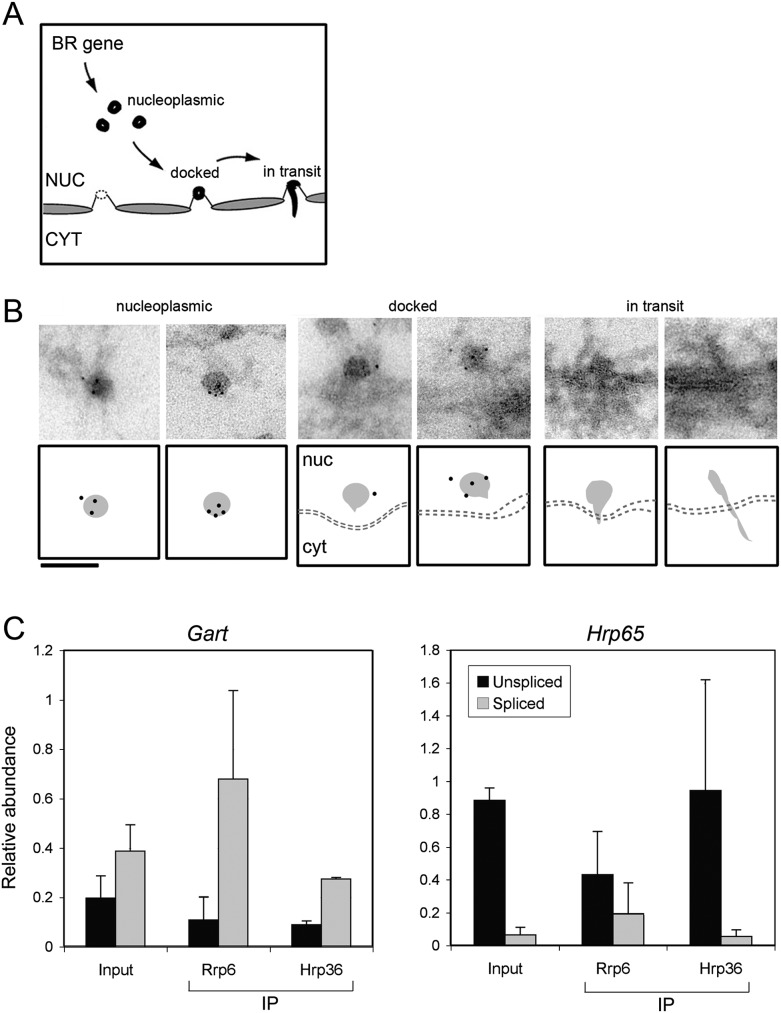
FIGURE 4.
The post-transcriptional association of Rrp6 with mRNPs analyzed by immuno-EM and RIP. (A) Schematic representation of the transport of BR pre-mRNPs through the nucleoplasm, the docking at the NPC, and the translocation to the cytoplasm. (B) Immuno-EM analysis of Rrp6 in BR particles during transport to and translocation through the NPC. The figure shows examples of BR mRNPs at different stages of nucleo-cytoplasmic transport, as indicated. Schematic interpretations are provided under each micrograph. The bar represents 100 nm. (C) The association of Rrp6 with mRNPs in C. tentans cultured cells was analyzed by RIP and RT-qPCR. An antibody against Hrp36 was used in parallel as a reference. The abundances of unspliced and spliced transcripts for two different genes, Gart and Hrp65, were analyzed. For each gene, the abundance of an exonic sequence was also quantified for normalization purposes. The histograms show the relative abundances of spliced and unspliced RNAs relative to the level of the exonic reference sequence for that same gene. The values are averages from three independent experiments, each with two technical replicates (n = 3).

