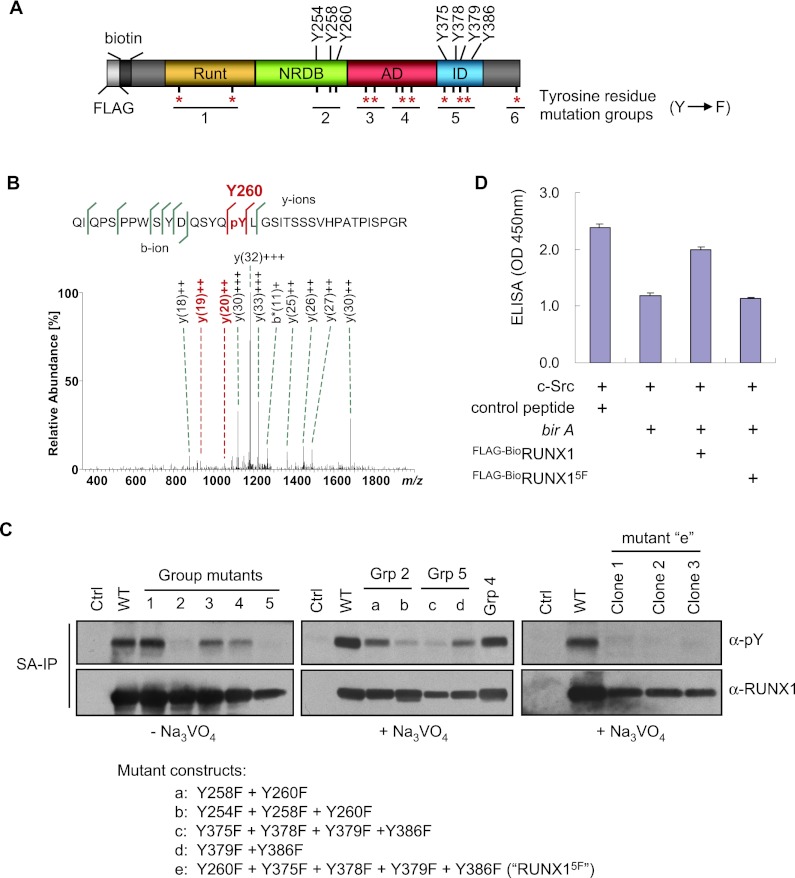
Figure 3.
Mapping of RUNX1 phosphorylated tyrosine residues. (A) Schematic diagram of RUNX1 (murine isoform 3) showing positions of its 15 tyrosine residues relative to functional domains. The most highly conserved tyrosine residues among species and different RUNX family members are indicated with a red asterisk (see Supplemental Fig. S4 for more details). The groups of tyrosine residues mutated to phenylalanine are indicated. (RUNT) rnt homology domain (DNA- and CBFβ-binding domain). (B) Fragment ion mass spectrum of the tryptic peptide QIQPSPPWSYDQSYQpYLGSITSSSVHPATPISPGR indicating phosphorylation of Tyr 260 (murine isoform 3 numbering). The y192+ and y202+ (both shown in red) localize the phosphorylation site to Y260. (C) SA-IP and α-pY Western blot of uninduced L8057 cells stably expressing Flag-BioRUNX1 group mutants (as shown in A). (Left panel) Cells without Na3VO4 treatment. (Middle and right panels) Cells were treated with 1.25 mM Na3VO4 for 15 min prior to SA-IP. (Right panel) Three independent clonal cell lines are shown. (D) c-Src in vitro kinase assay of Flag-BioRUNX1 and Flag-BioRUNX15F purified by streptavidin pull-down from TPA-induced L8057 cells. The data represent the mean of three measurements ± SEM. See the legend for Figure 2B for additional details.

