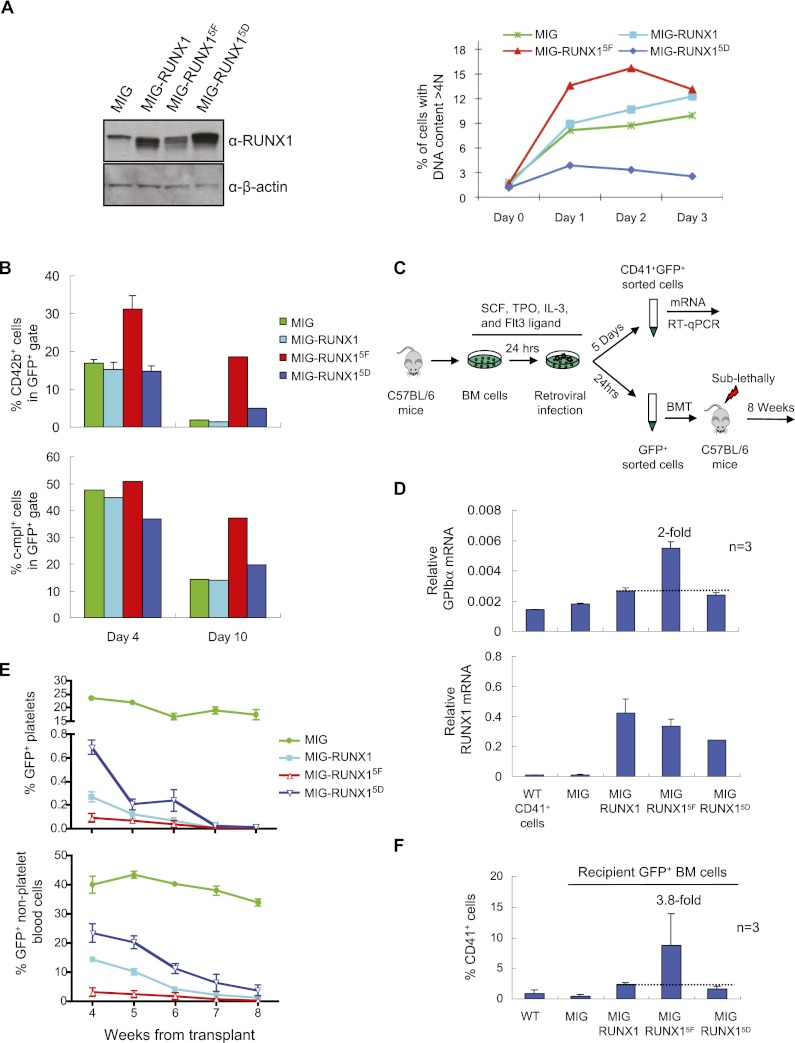
Figure 4.
Inhibitory role of tyrosine phosphorylation on RUNX1 function in megakaryopoiesis. (A) Retroviral expression of RUNX1 phosphorylation mutants in L8057 cells. (Left) RUNX1 Western blot of GFP+-sorted L8057 cells retrovirally transduced with the empty vector (MIG), wild-type RUNX1 (MIG-RUNX1), RUNX1Y260F, Y375F, Y378F, Y379F, Y386F (MIG-RUNX15F), or RUNX1Y260D, Y375D, Y378D, Y379D, Y386D (MIG-RUNX15D). (Right) DNA ploidy analysis of the cells induced with 50 nM TPA for the indicated time. The percentage of cells with DNA content >4N is shown. (B) Flow cytometry analysis of GFP+ cells for CD42b and c-mpl expression of E13.5 murine fetal liver cells transduced with each of the retroviral constructs and placed in liquid culture with TPO for either 4 or 10 d. (C) Schematic diagram of retroviral transduction experiments of bone marrow from C57BL/6 wild-type mice. (D) qRT–PCR analysis for GPIbα and RUNX1 mRNA transcripts in GFP+CD41+ or CD41+ wild-type cells flow-sorted after 5 d of liquid culture with TPO. Measurements were normalized to β-actin mRNA levels and represent the mean of three experiments ± SEM. Fold change relative to wild-type RUNX1 is indicated. (E) Loss of engraftment with overexpression of RUNX1 and RUNX1 tyrosine phosphorylation mutants. The percentage of GFP+ platelets (top) or all other GFP+ peripheral blood cells (bottom) in recipient mice at the indicated time from transplant is shown. An equal number of GFP+ cells were injected into each mouse at the start of the transplant. (F) Flow cytometry analysis of GFP+ bone marrow cells for CD41 expression in recipient mice 8 wk following transplant. Measurements represent the mean of three experiments ± SEM. The fold change relative to wild-type RUNX1 is indicated.

