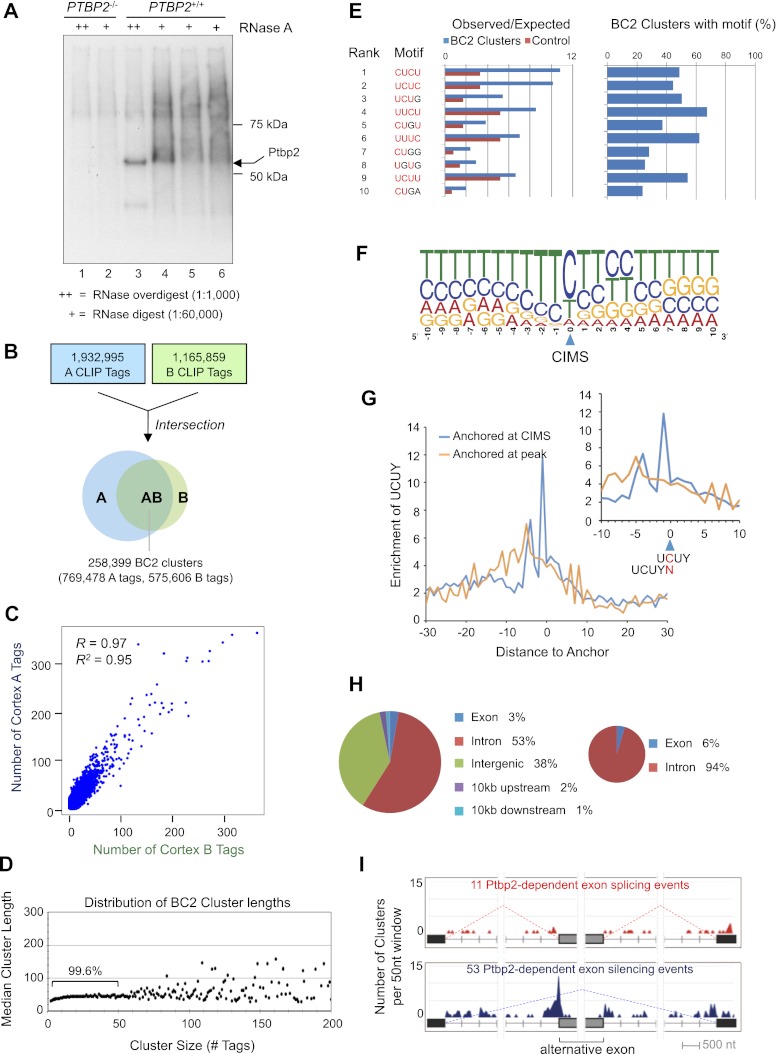
Figure 3.
Ptbp2 HITS-CLIP. (A) Autoradiogram of nitrocellulose membrane containing protein–RNA complexes purified from Ptbp2-null (lanes 1,2) and wild-type (lanes 3–6) E18.5 mouse brains treated with a high (++) or low (+) concentration RNase A. (B) Summary of CLIP tag filtering and clustering to identify BC2 clusters. (C) Analysis of cortex A and B CLIP tag counts in each BC2 cluster. (D) Comparison of the length and numbers of CLIP tags for each BC2 cluster. (E) Top 10 tetramers present in BC2 sequences as determined by differences between the observed and expected frequency in BC2 compared with the shuffled control sequences. (F) CIMS-based identification of UCUY as a consensus binding site for Ptbp2. (G) Enrichment of UCUY near CIMS. (H) Genomic distribution of BC2 clusters (Ptbp2-binding events). (I) Distribution of BC2 clusters near alternative exons that are misspliced in Ptbp2-null brains. The total number (Y-axis) of BC2 clusters centered in each 50-nt window relative to alternative and flanking constitutive splice sites is shown for exons that exhibit increased skipping (top panel) and splicing (bottom panel) in Ptbp2 knockout compared with wild-type brains. Only BC2 clusters residing within the regions specified in the figure are displayed.

